Download
1 / 49
490 likes | 516 Views
Learn the importance of Water Accounts, concepts of Water Accounting, and how to compile Water Accounts at Levels 1 and 2, including data options, examples, and international approaches. The session includes group exercises and discussions.

E N D
Outline Outline • Learning objectives • Review of Level 0 (5m) • Level 1 (Compilers) • Concepts (15m) • Group exercise & Discussion (30m) • Level 2 (Data providers) • Data options, examples & issues (15m) • Group exercise & Discussion (15m) • Closing Discussion (10m) SEEA-CF - Water accounts
1. Learning objectives Learning objectives: Levels 1 and 2 • Level 1: • Understand why Water Accounts are important and how they link to policy • Understand the basic concepts of Water Accounting • Understand how water is treated in the SEEA • Learn the steps of compiling a Water Account • Level 2: • Understand the data options and sources • Understand the important conceptual issues • Be aware of how other countries have approached Water Accounting SEEA-CF - Water accounts
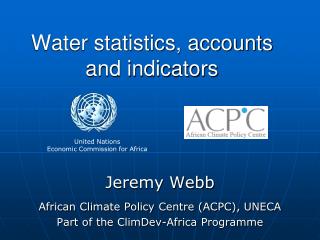
2. Review of Level 0 Water Account • Learning objectives • Review of Level 0 (5m) • Level 1 (Compilers) • Concepts (15m) • Group exercise & Discussion (30m) • Level 2 (Data providers) • Data options, examples & issues (15m) • Group exercise & Discussion (15m) • Closing Discussion (10m) SEEA-CF - Water accounts
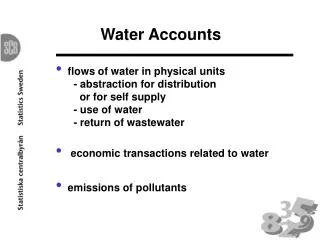
2. Review of Level 0 Are we depleting our water assets? Renewable supply The economy Abstraction & Use Water Assets Returns Water account - SEEA CF
2. Review of Level 0 What? • Availability (stocks) and changes (flows) of water resources • Supply and use of water within the economy Why? • Policies on water security, water resources management • Links to economic accounts • Basis for SEEA-WATER, SEEA-EEA • Indicators: • Total water use (by source, purpose, etc.) • Water intensity/productivity • Variability in water resources, trends (droughts, floods) SEEA-CF - Water accounts
2. Review of Level 0 What does a Water Account look like? Physical Supply Table for Water Physical Use Table for Water SEEA-CF - Water accounts
2. Review of Level 0 What do you need to compile a Water Account? • Data: • Water stocks by source • Supply (abstraction, production, return flows) • Use (abstraction, intermediate consumption, return flows); • Expertise: • Statisticians • Hydrologists • Water industry specialists SEEA-CF - Water accounts
2. Review of Level 0 Examples of water-related SDG indicators Safe and Affordable Drinking Water 6.1.1. Safely managed drinking water services Improve Water quality, wastewater treatment and safe reuse 6.3.1 Safely treated wastewater Increase water-use efficiency and ensure freshwater supplies 6.4.1 Change in water use efficiency over time 6.4.2 Level of water stress SEEA-CF - Water accounts
3. Level 1 Water Account • Learning objectives • Review of Level 0 (5m) • Level 1 (Compilers) • Concepts (15m) • Group exercise & Discussion (30m) • Level 2 (Data providers) • Data options, examples & issues (15m) • Group exercise & Discussion (15m) • Closing Discussion (10m) SEEA-CF - Water accounts
3. Level 1 Learning objectives • Level 1: • Understand why Water Accounts are important and how they link to policy • Understand the basic concepts of Water Accounting • Understand how water is treated in the SEEA • Learn the steps of compiling a Water Account SEEA-CF - Water accounts
3. Level 1 Accounts and data “Lack of integrated water data is a systematic impediment to informed decision making related to the sustainable use of water resources. Data are needed to provide information not just about water quantity, both on the surface and underground, but also about its quality, social and economic relations as well as environmental dimensions.” Conclusion from Session 6.4 “Data for All” of the 5th World Water Forum • Accounts provide a framework for arranging data. They enable data from different sources to be integrated. They also enable gaps and deficiencies in primary data sources to be identified and addressed. SEEA-CF - Water accounts
3. Level 1 Water policy issues * http://unstats.un.org/unsd/envaccounting/WWAP_UNSD_WaterMF.pdf SEEA-CF - Water accounts
3. Level 1 Concepts • The hydrological cycle • Stocks, supply, abstraction and use • Reminder! • Stocks and flows • Supply and use chains • Accounting identities • Treatment of households • Residence vs. Territorial principles SEEA-CF - Water accounts
3. Level 1 The Hydrological Cycle SEEA-CF - Water accounts
3. Level 1 Water asset diagram Unit: million m3 SEEA-CF - Water accounts
3. Level 1 Water asset account (from diagram) • Surface water = Artificial reservoirs + Lakes + Rivers and streams + Glaciers, snow and ice Unit: million m3 SEEA-CF - Water accounts
3. Level 1 Unit: million m3 SEEA-CF - Water accounts
3. Level 1 Physical Water Use Table (from Diagram) Unit: million m3 SEEA-CF - Water accounts
3. Level 1 Compilation Group Exercise (30m) • Situation: • Have a simplified Water Asset Diagram • Have a simplified Water Supply & Use Diagram • Objective (Groups of 3-5): • Compile a Water Asset Account • Compile a Supply & Use Table for Water • Report results SEEA-CF - Water accounts
3. Level 1 Group Exercise: Exercise 1 Water Asset Account Water Asset Diagram Water Asset Account =B+C+D+E+F =H+I+J+K+L =A+G-M Calculate Totals, Opening Stock, Closing Stock SEEA-CF - Water accounts
3. Level 1 Group Exercise: Exercise 2 Water Supply and Use Table Water Supply and Use Table Water Supply and Use Diagram =A+B+C+D =I+J+K+L =E+F+G+H+M =A+B+C+D =I+J+K+L =E+F+G+H+M Calculate Total abstracted water, Total water use Surface water = Lakes + Rivers and Streams + Artificial Reservoirs • Water supply: “own use” = Abstracted – Total Distributed • For other sectors: “own use” is the amount abstracted SEEA-CF - Water accounts
3. Level 1 • Is everyone clear on the objectives? • 30 minutes group work • Please ask questions! • Results: • Each group report: 1. Opening and closing stock 2. Total supply & use of water • Bonus questions: 1. What was the largest source of reductions in stock? 2. What is the main use of water? SEEA-CF - Water accounts
3. Level 1 The answers Water Asset Account • Opening Stock = 1,705,500 Mm3 • Closing Stock = 1,738,825 Mm3 • Largest source of reductions = Evaporation from Soil water SEEA-CF - Water accounts
3. Level 1 The answers Water Supply & Use Table • Total supply of water = 36,310 million m3 • Total use of water = 36,310 million m3 • The main use of water is Soil Water for Agriculture, Forestry and Fishing SEEA-CF - Water accounts
4. Level 2 Water Account • Learning objectives • Review of Level 0 (5m) • Level 1 (Compilers) • Concepts (15m) • Group exercise & Discussion (30m) • Level 2 (Data providers) • Data options, examples & issues (15m) • Group exercise & Discussion (15m) • Closing Discussion (10m) SEEA-CF - Water accounts
4. Level 2 Learning objectives • Level 2: • Understand the data options, sources and methods used • Understand the important conceptual issues • Be aware of how other countries have approached Water Accounting SEEA-CF - Water accounts
4. Level 2 Data options Stock Supply Use There are many sources of national and global water data… Types of water data SEEA-CF - Water accounts
4. Level 2 Data options • Global data sources • Data on water and land cover are available from international agencies or research organisations: • FAO Aquastathttp://www.fao.org/nr/water/aquastat/main/index.stm • WHO World Climate Data and Monitoring Program (WCDMP) http://www.wmo.int/pages/prog/wcp/wcdmp/index_en.php • WMO World Hydrological Cycle Observing System (WHYCOS) http://www.whycos.org/whycos/ SEEA-CF - Water accounts
4. Level 2 Guidelines on methods Statistical Guidelines • International Recommendation for Water Statistics (IRWS) • Statistical Data and Metadata Exchange (or SDMX) • World Meteorological Organization Core Metadata Standard Spatial Guidelines • ISO (e.g. ISO 19115 for geographic information)\ • Infrastructure for Spatial Information in the European Community (INSPIRE) Methodological Guidelines • Guide to Meteorological Instrument and Methods of Observation • Guidelines on the Role, Operation and Management of National Hydrological Services • International Benchmarking Network for Water and Sanitation Utilities • A System of Integrated Agricultural Censuses and Surveys • Global Annual Assessment of Sanitation and Drinking Water • MDG reporting standards (for water supply and sanitation) SEEA-CF - Water accounts
4. Level 2 Common problems in compilation of water accounts Classification of units to industry • Especially when engaged in multiple activities (e.g. water supply, sewerage and hydro-electricity generation) Water supply and sewerage industry • In most countries, national accounts do not separate water supply and sewerage industries Losses in the recording process • Losses in distribution • Flows for use of water in hydro-electricity and water for cooling Error of generalization • Spatial referencing: economic vs hydrological data • Scale of data: national data may hide regional variation • Seasonality: Annual averages may hide seasonal variations and extremes (e.g. floods and droughts) • Data quality • Confidentiality of business data Data SEEA-CF - Water accounts
4. Level 2 Some Global and country examples • UNEP-WCMC: Composite map of global ecosystem assets (Freshwater component) • Australia, Samoa, Fiji SEEA-CF - Water accounts
4. Level 2 UNEP-WCMC: Composite map of global freshwater resources = Stock + (precipitation – evapotranspiration) Source: Dickson, Blaney et al. (2014) SEEA-CF - Water accounts
4. Level 2 SEEA-CF - Water accounts
4. Level 2 Australia`s water accounts are not just tables Percentage of mean annual rainfall July 1998 – June 2001 July 2002 – June 2005 SEEA-CF - Water accounts
Key Wastewater Water 4. Level 2 Experimental water accounts for Samoa, 2013-14 (Millions m3) Sewerage WaterSupply 0.18 ? ? SWA 6.63 IWS 6.48 SWA 1.53 IWS 0.32 SWA 17.61 IWS 13.75 ? 0.47 0.09 13.14 1.85 ? 46.89 Agriculture Manufacturing* Electricity Other industries Households SWA 26.33 IWS 20.56 2.00 71.70 0.03 0.48 0.38 ? 31.37 ? ? ? ? 71.7 Inland Water Resources *Draft Experimental Water Accounts for Samoa, 2011-12 to 2013-14, version 1.2 (29 September 2015) SEEA-CF - Water accounts
4. Level 2 Preliminary water accounts for Fiji (piped water), 2016 (Millions m3) 3.0 18.0 46.2 Domestic Commercial Government Water supply ? 18.0 3.0 Sewerage ? 3.0 55.6 125.7 67.1 Inland water sources Losses in Distribution SEEA-CF - Water accounts
4. Level 2 A lot of progress can be made quickly.. SEEA-CF - Water accounts
4. Level 2 Group exercise (15m) (Groups of 3-5) • What is the main water issue in your country? • Suggest three measures that could be used to address it? • Report: • The water issue you selected • The three measures you selected • Are national data available in your country for these measures? • Discussion: • What other measures could you suggest? • What other data sources could you suggest? SEEA-CF - Water accounts
References References References • Australian Bureau of Statistics (2014). Water Account, Australia, 2012-13. http://www.abs.gov.au/ausstats/abs@.nsf/mf/4610.0 • Dickson, B., Blaney, R., Miles, L., Regan, E., van Soesbergen, A., Väänänen, E., . . . van Bochove, J. (2014). Towards a global map of natural capital: Key ecosystem assets. (No. DEW/1824/NA). Nairobi, Kenya: UNEP. • Statistics Canada. (2010). Human activity and the environment: Freshwater supply and demand in Canada (2010). (No. 16-201-XWE). Ottawa: Government of Canada. • UNSD (2009) 5th World Water Forum Istanbul: Topic 6.4 Data for All, Turkey, http://unstats.un.org/unsd/envaccounting/workshops/wwf2009/topicOutline.pdf • Vardon, M., Lenzen, M., Peevor, S., & Creaser, M. (2007). Water accounting in Australia. Ecological Economics, 61(4), 650-659. Further Information • System of Environmental-Economic Accounting, Central Framework(2012) SEEA-CF - Water accounts
Acknowledgement Acknowledgement • Materials prepared by: • TeerapongPraphotjanaporn • Research Assistant ESCAP Statistics Division praphotjanaporn@un.org • Hye Kyeong Choi • Consultant on Environment Statistics ESCAP Statistics Divisiongracechoi0102@gmail.com • Materials adapted from: • Advancing Natural Capital Accounting, a collaboration between The United Nations Statistics Division (UNSD), United Nations Environment Programme (UNEP) and the Secretariat of the Convention on Biological Diversity (CBD) and is supported by the Government of Norway. • https://unstats.un.org/unsd/envaccounting/eea_project/default.asp • Contact: seea@un.org SEEA-CF - Water accounts
5. Annex Annex • Water accounts table • Data options SEEA-CF - Water accounts
5. Annex Physical supply table for water SEEA-CF - Water accounts
5. Annex Physical use table for water SEEA-CF - Water accounts
5. Annex Data options SEEA-CF - Water accounts
5. Annex Data options SEEA-CF - Water accounts
5. Annex Data options SEEA-CF - Water accounts
5. Annex Data options SEEA-CF - Water accounts
5. Annex Data options SEEA-CF - Water accounts