Download
1 / 28
280 likes | 302 Views
Explore key data from the Kaiser/HRET Survey of Employer-Sponsored Health Benefits 1999-2017, covering premium increases, coverage trends, out-of-pocket max, and wellness initiatives.

E N D
Employer Health Benefits Survey 2017 Release Slides September 19, 2017
Figure 3Average Annual Increases in Premiums for Family Coverage Compared to Other Indicators, 2000-2017 * Estimate is statistically different from estimate for the previous year shown (p < .05). • SOURCE: Kaiser/HRET Survey of Employer-Sponsored Health Benefits, 1999-2017. Bureau of Labor Statistics, Consumer Price Index, U.S. City Average of Annual Inflation (April to April), 1999-2017; Bureau of Labor Statistics, Seasonally Adjusted Data from the Current Employment Statistics Survey, 1999-2017 (April to April).
Figure 12Percentage of All Workers Covered by Their Employer's Health Benefits, Both In Firms Offering and Not Offering Health Benefits, by Firm Size, 1999-2017 * Estimate is statistically different from estimate for the previous year shown (p < .05). SOURCE: Kaiser/HRET Survey of Employer-Sponsored Health Benefits, 1999-2017.
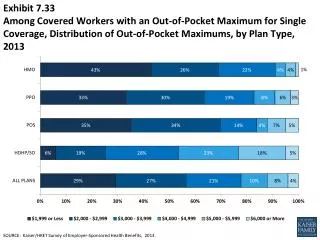
Figure 18Percentage of Covered Workers Enrolled in a Plan with an Out-of-Pocket Maximum for Single Coverage, 2009-2017 * Estimate is statistically different from estimate for the previous year shown (p < .05). NOTE: OOP refers to ‘out-of-pocket.’ Out-of-pocket maximums reported are for in-network services. Covered workers without an OOP maximum are considered to be exposed to at least the specified threshold. Some of these workers may be enrolled in plans whose cost-sharing structure has other limits that make it impossible to reach the specified threshold. SOURCE: Kaiser/HRET Survey of Employer-Sponsored Health Benefits, 2009-2017.
Exhibit 6: Among Firms Offering Health Benefits, Percentage of Firms Offering Various Wellness and Health Promotion Activities and Incentives, by Firm Size, 2017 Figure 23 * Estimate is statistically different between All Small Firms and All Large Firms estimates (p < .05). NOTE: 'Specific Wellness Programs' include 'Programs to Help Employees Stop Smoking', 'Programs to Help Employees Lose Weight', or 'Other Lifestyle or Behavioral Coaching'. SOURCE: Kaiser Family Foundation and Health Research & Educational Trust, Employer Health Benefits Survey, 2017.