Download
1 / 33
330 likes | 352 Views
This study explores the impact of mobility on MANET protocol performance, focusing on link and path duration metrics. Results and models for throughput and overhead are discussed, offering insights for protocol design.

E N D
PATHS: Analysis of PATH Duration Statistics and their Impact on Reactive MANET Routing Protocols Narayanan Sadagopan*, Fan Bai+, Bhaskar Krishnamachari*+, Ahmed Helmy+ * Computer Science Department + Electrical Engineering Department University of Southern California
Outline • Introduction and Motivation • Background on Mobility Models • Link/Path Duration Metrics • Results & Observations • Distributions at low and high mobility • Is it exponential?! • Models: Path Duration, Throughput & Overhead • Conclusions and Future Work
Introduction and Motivation • Mobility affects performance of MANET protocols significantly [IMPORTANT ‘Infocom BSH03’] • Mobility affects connectivity, and in turn protocol mechanisms and performance • In this study: • Closer look at the mobility effects on connectivity metrics (statistics of link duration (LD) and path duration (PD)) • Develop approximate expressions for LD & PD distributions (Is it really exponential? When is it exponential?) • Develop first order models for Tput & Overhead as f(PD) Protocol Mechanisms Performance (Throughput, Overhead) Mobility Connectivity
Mobility Models • Used the IMPORTANT framework and tools[BSH’03] • Rich set of mobility models that exhibit various spatial correlation and relative velocities • Four main models: • Random Waypoint (RW) [CMU Monarch, BMJHJ’98] • Reference Point Group Mobility (RPGM) [UCLA, HGPC’99] • Freeway (FW) • Manhattan (MH)
Mobility Models (contd.) • Random Waypoint Model (RWP) • A node picks random destination & random velocity [0, Vmax] • After reaching the destination, it stops for the “pause time”. • This procedure is repeated until simulation ends • Reference Point Group Mobility (RPGM) • A group’s general movement is determined by a logical reference point • Each node in a group follows the reference point with small deviation: • Angle Deviation Ratio(ADR) and Speed Deviation Ratio(SDR). • In our study ADR=SDR=0.1 • Two scenarios: Single Group (SG) and Multiple Group (MG)
Mobility Models (contd.) • Freeway Model (FW) • A node is restricted to its lane on the freeway • Velocity of a node is temporally dependent on its previous velocity • If two mobile nodes on the same freeway lane are within the Safety Distance (SD), the velocity of the following node cannot exceed the velocity of preceding node • Manhattan Model (MH) • Similar to Freeway model • Allows nodes to make turns at intersections Map for FW Map for MH
Connectivity Metrics • Link Duration (LD): • For nodes i,j, the duration oflink i-j is the longest interval in which i & j are directly connected • LD(i,j,t1)=t2-t1 • iff t, t1 t t2, > 0 : X(i,j,t)=1,X(i,j,t1-)=0, X(i,j,t2+)=0 • Path Duration (PD): • Duration of path P={n1,n2,…,nk} is the longest interval in which all k-1 links exist
Simulation Scenarios in NS-2 • Path duration computed for the shortest path (at graph level) until it breaks.Validated later via protocol paths. • Mobility Models (IMPORTANT tool) • Vmax= 1,5,10,20,30,40,50,60 m/s, • RPGM: 4 groups (called RPGM4) • Speed/Angle Deviation Ratio=0.1 • 40 nodes, in 1000mx1000m area • Radio range (R)=50,100,150,200,250m • Simulation time 900sec
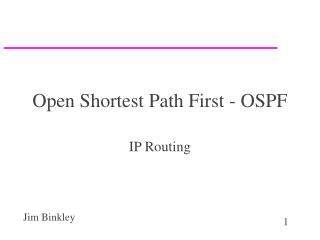
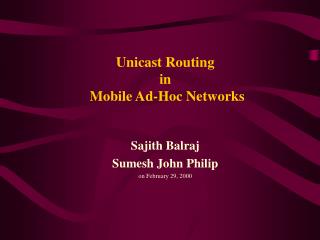
Link Duration (LD) PDFs • At low speeds (Vmax < 10m/s) link duration has multi-modal distribution for FW and RPGM4 • In FW due to geographic restriction of the map • Nodes moving in same direction have high link duration • Nodes moving in opposite directions have low link duration • In RPGM4 due to correlated node movement • Nodes in same group have high link duration • Nodes in different groups have low link duration • At higher speeds (Vmax > 10m/s) link duration does not exhibit multi-modal distribution
Nodes moving in opposite directions FW model Vmax=5m/s R=250m Nodes moving in the same direction/lane Multi-modal Distribution of Link Duration for Freeway model at low speeds
RPGM w/ 4 groups Vmax=5m/s R=250m Nodes in different groups Nodes in the same group Multi-modal Distribution of Link Duration for RPGM4 model at low speeds
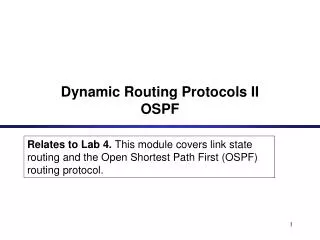
RW RPGM (4 groups) Vmax=30m/s R=250m FW
Path Duration (PD) PDFs • At low speeds (Vmax < 10m/s) and for short paths (h2) path duration has multi-modal forFW and RPGM4 • At higher speeds (Vmax > 10m/s) and longer path length (h2) path duration can be reasonably approximated using exponential distribution for RW, FW, MH, RPGM4.
Nodes moving in opposite directions FW Vmax=5m/s h=1 hop R=250m Nodes moving in the same direction Multi-modal Distribution of Path Duration for Freeway model at low speeds, low hops
Nodes in different groups RPGM4 Vmax=5m/s h=2 hops R=250m Nodes in the same group Multi-modal Distribution of Path Duration for RPGM4 model at low speeds, low hops
RW RPGM4 h=2 h=4 100 Vmax=30m/s R=250m FW h=4
Exponential Model for Path Duration (PD) • Let path be the parameter for the exponential PD distribution: PD PDF f(x)= pathe- path x • As path increases average PD decreases (and vice versa) • Intuitive qualitative analysis: • PD=f(V,h,R); V is relative velocity, h is path hops & R is radio range • As V increases, average PD decreases, i.e., path increases • As h increases, average PD decreases, i.e., path increases • As R increases, average PD increases, i.e., path decreases
Exponential Model for PD But, PD PDF f(x)= pathe- path x
RW h=2 RGPM4 h=4 FW h=4 Vmax=30m/s R=250m FW h=4 - Correlation: 94.1-99.8%
RW h=2 RGPM4 h=4 Vmax=30m/s R=250m - Goodness-of-fit Test FW h=4
Effect of Path Duration (PD) on Performance (in-progress): Case Study for DSR • PD observed to have significant effect on performance • (I) Throughput: First order model • T: simulation time, D: data transferred,Tflow: data transfer time,Trepair: total path repair time, trepair: av. path repair time,f: path breakfrequency
Effect of PD on Performance (contd.) • (II) Overhead: First order model • Number of DSR route requests= • p: non-propagating cache hit ratio, N: number of nodes • Evaluation through NS-2 simulations for DSR • RPGM exhibits low , due to relatively low path changes/route requests Pearson coefficient of correlation () with
Conclusions • Detailed statistical analysis of link and path duration for multiple mobility models (RW,FW,MH,RPGM4): • Link Duration: multi-modal FW and RPGM4 at low speeds • Path Duration PDF: • Multi-modal FW and RPGM4 at low speeds and hop count • Exponential-like at high speeds & med/high hop count for all models • Developed parametrized exponential model for PDPDF, as function of relative velocity V, hop count h and radio range R • Proposed simple analytical models for throughput & overhead that show strong correlation with reciprocal of average PD
Future Work • Apply path duration analysis to various ad hoc protocols • Attempt to explain: Why does path duration distribution become exponential? • Analyze convergence time and cache performance to account for varying performance between different protocols. Use it to extend first order models. • Analysis of effects of mobility on protocol mechanisms • Extend and release the IMPORTANT mobility tool: • URL: http://nile.usc.edu/important
D: total data transferred during simulation • T: simulation time • Tflow: data transfer time • Trepair: total time spent in repairing paths • trepair: time to repair path each time • PD: average path duration • f: frequency of path breakage, • r: is constant data rate=D/Tflow • N: number of of nodes
Non-propagating Cache Hit Ratio in DSR (independent of velocity!)