Download
1 / 26
260 likes | 282 Views
This report examines the impact of migration, fuel costs, and community viability in Alaska. It explores the factors driving migration, including the role of fuel costs, and assesses their effects on subsistence participation, local governments, utilities, and businesses. The report also investigates other factors affecting community viability and migration, such as employment opportunities. Opportunities for better data collection and understanding are discussed.

E N D
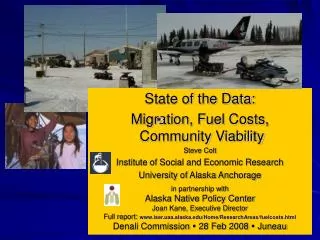
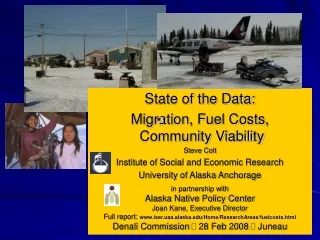
State of the Data: • Migration, Fuel Costs, Community Viability • Steve Colt • Institute of Social and Economic Research • University of Alaska Anchorage in partnership with Alaska Native Policy Center Joan Kane, Executive Director Full report: www.iser.uaa.alaska.edu/Home/ResearchAreas/fuelcosts.html Denali Commission 28 Feb 2008 Juneau
Initial Research Questions • Has migration accelerated? • If so, who is moving, to where, and why? • If so, are fuel costs a major driver? • What other factors may be causing migration? • How are fuel costs affecting subsistence participation? • How are fuel costs affecting the viability of local governments, utilities, and local businesses? • Are there major factors – other than fuel costs – affecting community viability and migration, such as lack of employment? • Do regional patterns emerge? Can data be collected and reported regionally?
Topics for Today • Migration flows • Reasons for migration • Role of fuel costs • Other factors • Opportunities for better data and better understanding ...a research memorandum and digital - Web literature archive are also being prepared
Sources • Major primary data sources: • U.S. Census • DOLWD (population, migration), DHHS (births, deaths) • ISER Survey of Living Conditions in the Arctic (SLiCA): 2003; n=663 Natives; North Slope, Nana, Bering Straits regions) • First Alaskans Institute Attitudinal Survey (2007; n=902: 600 Natives + 302-non-Native; statewide) • Literature: 40+ papers circa 1960-present, most of which use the same data sources
Resource booms fueled statewide growth and migration Salmon boom shows permanent population does not always follow economic boom Salmon Pipeline WW2 / Military Oil money Gold Pulses of migration shown in yellow source: ISER, Census, DOL
Net Migration– Statewide 1980-2007 source: AK DOL (pfd)
Net Migration: Rural Census Areas 1980-2007 source: AK DOL (pfd)
Declining births may turn migration into absolute population decline Births – rural AK Net migration – rural AK source: DOL (pfd); DHHS births by mother’s place of residence
Wade-Hampton Census Area:More people born than leaving source: DOL (pfd); DHHS births by mother’s place of residence
Overall, no long-term acceleration in migration However, • Rates vary dramatically across communities • Smallest communities are losing population • Of communities with 100 or fewer people in 2000, two-thirds have lost population. • This has been going on for a long time (eg 1800s to present) (Alonso & Rust 1976)
Cumulative net migration during 2000-2007% of 2000 pop., by census area
Age structure of 21 of Alaska’s smallest communities, year 2000 source: US Census 2000
Why are people moving? • Fuel costs • Other factors
Primary energy consumption per Alaskanbarrels oil per person per year
Effect of recent fuel price run-up...... • Average person in a PCE community uses 1,000 gal of diesel & gasoline • Average price increase = $2.00/gal • Arithmetic:$2,000 -- 8,000 increase per household per year • (includes electricity, community buildings) source: ISER/Colt “Energy Flow in Alaska 2005”
Why did you move?FAI survey open-ended: source: FAI Attitudinal Survey (2007)
What would it take for you to return? (open-ended) source: FAI Attitudinal Survey (2007)
Broadly speaking, • Neither FAI nor SLiCA respondents mention fuel costs in open-ended questions • Social factors / “Gorillas in the Room” • Alcohol • Public safety • Domestic violence
Example to ponder: North Slope • high wages, low fuel costs (subsidized), police officers, subsistence opportunities • People still leave
Data Opportunities: secondary data • DOL migration data based on PFD zip codes • continue net migration by census area • add net migration by age-sex • add origin-destination • add net migration by community
Opportunities: new primary data • Panel study of ANCSA shareholders • Sample frame exists • Attrition would be minimized • provides Alaska-specific data (subsistence, quality of life...)
Primary Data • ANCSA shareholder survey does not pick up young people; hence, • Survey of rural college students, rural high school students (tough),or similar subgroup • FAI did pilot survey at AFN youth conference
Other opportunities • Comprehensive housing survey • Omnibus social survey • characteristics • behavior • expenditures • attitudes
Thank You! www.iser.uaa.alaska.edu www.firstalaskans.org