Download
1 / 22
220 likes | 240 Views
Learn about the Seattle Transportation Benefit District (STBD) and how it has improved transit service and access in Seattle. Discover the impact of STBD funding, increased ridership, and lessons learned in creating a functional and equitable transit network.

E N D
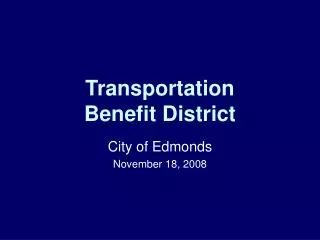
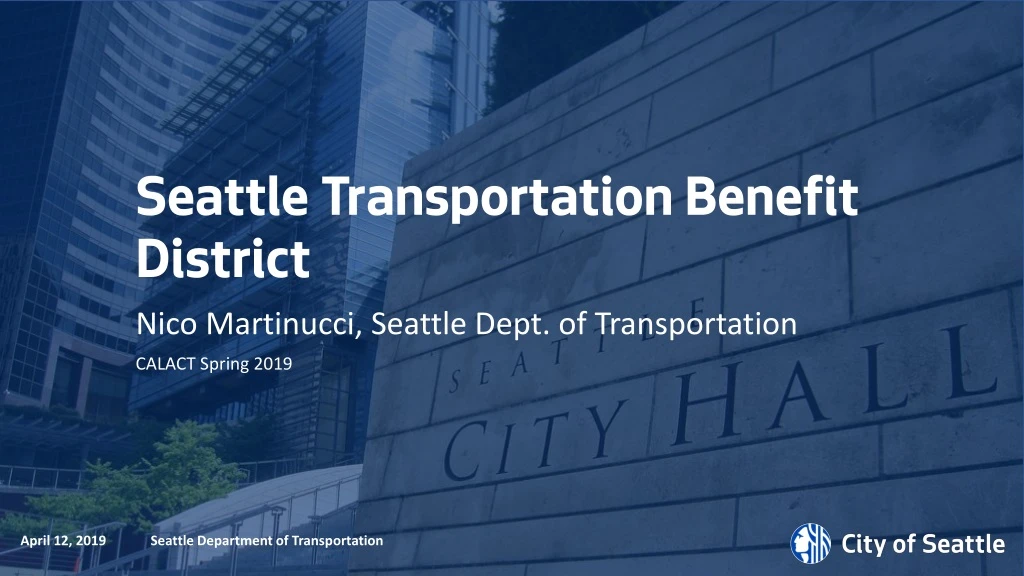
Seattle Transportation Benefit District Nico Martinucci, Seattle Dept. of Transportation CALACT Spring 2019
April 2014 King County Prop. 1 Results: 44% Yes, 55% No Source: Seattle Transit Blog
November 2014 – Seattle Prop. 1 • Seattle adds Prop. 1 to November 2014 ballot after King County measure doesn’t pass • County sees improved sales tax revenue • Messaging shift from saving service to adding service • Approved on November 4, 2014 • 62% Yes, 38% No • Generates over $50M annually for transit service and access
Added Service Across Seattle Every Urban Center and Urban Village received new transit trips thanks to STBD
Access to Frequent Transit • 2015: 25% • 2016: 51% • 2017: 64% • 2018: 67% • 2019: 71% • Surpassed 2020 Goal by 14% • Within 5% of 2025 Goal 7
Low Income Access to Transit NEW: Transportation Equity Workgroup 6
1. Voter support is key 2014, STBD Prop 1($50M/yr, 6 years);2015, Move Seattle($103M/yr, 9 years) 2006, Transit Now($55M/yr) 1996, ST1($390M/yr, 10 years);2008, ST2($1.2B/yr, 15 years);2016, ST3($2.2B/yr, 24 years)
2. Each community has different needs • Creating a functional network is not “one size fits all” • Frequency vs. Coverage • Peak vs. All-day vs. Nights & Weekends • What is the greatest need for your jurisdiction? What is most valued?
3. Small improvements can have big impacts… • Metro’s Network • (~4.4M Annual Service Hours) • STBD’s Total Investment • (~350k Annual Service Hours)
3. …but think big too! 81,000 73,000 65,000 36,000 2017 2018
4. Access is as important as service Q1 2019: 1,720,600 trips * *May be closer to 33% in Seattle
5. Think beyond productivity of Seattle households are within a 10-minute walk of 10-minute or better all-day transit service 71% of Urban Villages (growth centers) are served by at least one route providing 15-minute or better service of Frequent Transit Network routes have a minimum of 30-minute service, 18-hours per day, 7-days per week
6. Think carefully about the role of TNCs • Seattle Times, November 2018 • ~91,000 daily TNC rides in Seattle, 40,000 starting in greater downtown • Data is important! • SFCTA, October 2018 • In SF, TNCs accounted for ~50% of change in congestion, 2010 – 2016 • Congestion affects transit too!
6. Think carefully about the role of TNCs • University of Kentucky, November 2018 • TNCs enter the market: Light/Heavy Rail -1.3%, Bus -1.7% (per year, cumulative!) • Time is of the essence! • UC Davis, October 2017 • Between 49% and 61% of TNC trips would’ve been by walking, biking, transit, or not at all • Don’t believe the hype!
Questions? Thanks!