Download
1 / 39
390 likes | 530 Views
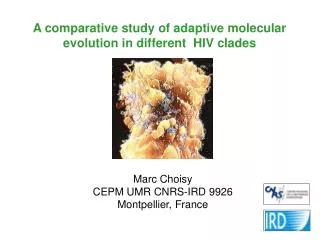
A comparative study of adaptive molecular evolution in different HIV clades. Marc Choisy CEPM UMR CNRS-IRD 9926 Montpellier, France. HIV-1. HIV-2. HIV-2. HIV-1 M. HIV-1 N. HIV-1 O. Adaptive evolution ?. Adaptive evolution. Darwinian evolution (mutation + selection).

E N D
A comparative study of adaptive molecular evolution in different HIV clades Marc Choisy CEPM UMR CNRS-IRD 9926 Montpellier, France
HIV-1 HIV-2
HIV-2 HIV-1 M HIV-1 N HIV-1 O
Adaptive evolution Darwinian evolution (mutation + selection) Purifying selection Neutral evolution (mutation alone)
A C T A A A T G G Thr Lys Trp dN dS A C T A A G T G G A C T A A C T G G Thr Lys Trp Thr Asn Trp No selection Selection Molecular evolution dN/dS>1 dN/dS<1 dN/dS=1
Lipid membrane Capsid gag pol env gp120 gp41 enzymes envelop proteins HIV-1 M A dN/dS HIV-1 M B HIV-1 M C 1 0 HIV-1 M C HIV-1 M B HIV-1 M A HIV-2 A HIV-2 A 10000 0 RNA
p1 p2 p0 p3 w2 w0 w3 w1 LRT w = dN/dS = p0*w0+ p1*w1+ p2*w2+ p3*w3 w = dN/dS = p0*w0+ p1*w1+ p2*w2
1 Posterior probabilities : f0i, f1i, andf2i Prior probabilities : p0, p1, and p2 95% 5’ 3’ 2 wi = dN/dSi = f0i*w0+ f1i*w1+ f2i*w2 w = dN/dS = p0*w0+ p1*w1+ p2*w2
95% HIV-1 M A HIV-1 M B HIV-1 M D HIV-1 M C HIV-1 O HIV-2 A 1 wi = f0i*w0+ f1i*w1+ f2i*w2 2
95% 1
Positively selected sites tend to occur at the same position in different clades, except for HIV-2 Test 1 : H0 : no match between +vely selected sites H1 : match between +vely selected sites
H1 vs H0 H2 vs H0 Positively selected sites do not tend to be related to epitopic sites Test 2 : H0 : random repartition of +vely selected sites with respect to epitopes H1 : no match between +vely selected sites and epitopes H2 : match between +vely selected sites and epitopes
Positively selected sites tend to occur on N-glycosylation sites Test 3 : H0 : no match between +vely selected sites and glycosylation sites H1 : match between +vely selected sites and glycosylation sites
Not that much difference between clades Test 4 : H0 : +vely selected sites have the same strength H1 : +vely selected sites do not have the same strength
CONCLUSIONS Positively selected sites tend to occur at the same position in different clades, except for HIV-2 Positively selected sites do not tend to be related to epitopic sites Positively selected sites tend to occur on N-glycosylation sites Similar intensity of selection across clades
CONCLUSIONS Positively selected sites tend to occur at the same position in different clades, except for HIV-2 Positively selected sites do not tend to be related to epitopic sites Positively selected sites tend to occur on N-glycosylation sites Similar intensity of selection across clades Moderates conclusions from Gaschen et al 2002
CONCLUSIONS Positively selected sites tend to occur at the same position in different clades, except for HIV-2 Positively selected sites do not tend to be related to epitopic sites Positively selected sites tend to occur on N-glycosylation sites Similar intensity of selection across clades Confirms the glycan shield model of Kwong et al. 2002
ACKNOWLEDGEMENTS Contributors: C. H. Woelk, University of California San Diego, USA. D. L. Robertson, University of Manchester, UK. J. F. Guégan, CEPM, UMR CNRS-IRD 9926, Montpellier, France. Data: Kuiken, C., et al. (2000). HIV Sequence Compendium. Los Alamos, NM, USA: Theoretical Biology and Biophysics Group, Los Alamos National Laboratory. Korber, B., et al. (2000). HIV Molecular Immunology. Los Alamos, NM, USA: Theoretical Biology and Biophysics Group, Los Alamos National Laboratory. Programs: Yang, Z. H. (1997). PAML: a program package for the phylogenetic analysis by maximum likelihood. Computer Applications in the Biosciences13, 555-556. Hansen, J. E., et al. (1998) NetOglyc: prediction of mucin type O-glycosylation sites based on sequence context and surface accessibility. Glycoconjugate Journal15, 115-130.
PAUP* ML on model of codon substitution dN/dS= w0p0 + w1p1 + w2p2