Download
1 / 1
10 likes | 377 Views
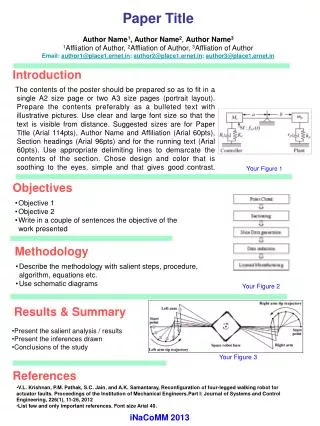
Poster title goes here, containing strictly only the essential number of words. First Author’s Name, Second Author’s Name, Third Author’s Name Affiliation of First Author, Affiliation of Second Author, Affiliation of Third Author. Abstract: First…

E N D
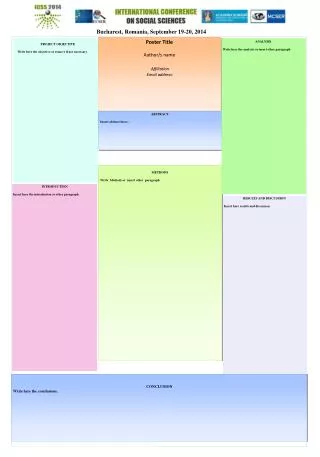
Poster title goes here, containing strictly only the essential number of words... First Author’s Name, Second Author’s Name, Third Author’s Name Affiliation of First Author, Affiliation of SecondAuthor, Affiliation of ThirdAuthor Abstract: First… The page size of this poster template is (48 x 39 Inch) in portrait format. Do not change this page size, when printing. Bear in mind you do not need to fill up the whole space allocated. Do not make your poster bigger than necessary just to fill that given size. Results: Importing / inserting files… Images such as photographs, graphs, diagrams, logos, etc, can be added to the poster. To insert scanned images into your poster, go through the menus as follows: Insert / Picture / From File… then find the file on your computer, select it, and press OK. The best type of image files to insert are JPEG or TIFF, JPEG is the preferred format. Notes about graphs… For simple graphs use MS Excel, or do the graph directly in PowerPoint. Graphs done in a scientific graphing programs (e.g. SPSS, Statistical) should be saved as JPEG or TIFF if possible. Figures are preferred but tables are sometimes unavoidable. Just highlight this text and replace with your own text. Replace this with your text. For more information please Contact: Tel: (+98) 21 - 22874490 -2 Fax: (+98) 21 - 22874489 E-mail: papers@qec.ir Figure 3. Captions to be set in Times or Times New Roman or equivalent, italic, between 18 and 24 points. photo). Left aligned if it refers to a figure on its left. Caption starts right at the top edge of the picture. Introduction: How to use this poster template… Simply highlight this text and replace it by typing in your own text, or copy and paste your text from a MS Word document or a PowerPoint slide presentation. The body text / font size should be between 24 and 32 points Times New Roman, Keep body text justified. Figure 4. Captions to be set in Times or Times New Roman or equivalent, italic, between 18 and 24 points. Right aligned if it refers to a figure on its right. Caption starts right at the top edge of the picture (graph or photo). Figure 1. Captions to be set in Times or Times New Roman or equivalent, italic, between 18 and 24 points. Left aligned if it refers to a figure on its left. Caption starts right at the top edge of the picture (graph or photo). • Methods: Tips for making a successful poster… • Simplify everything, avoid data overkill. • Headings of more than 6 words should be in upper and lower case, not all capitals. • Never do whole sentences in capitals or underline to stress your point, use bold characters instead. • When laying out your poster leave breathing space around you text. Don’t overcrowd your poster. • Be brief, and opt for photographs or drawings whenever possible to illustrate organism, protocol, or experimental design. Viewers don’t want to read about the gruesome details, however fascinating you might find them. • Spell check and get someone else to proof-read. Figure 2. Captions to be set in Times or Times New Roman or equivalent, italic, between 18 and 24 points. Right aligned if it refers to a figure on its right. Caption starts right at the top edge of the picture (graph or photo). Conclusions: Conclusions should not be mere reminders of your results. Instead, you want to guide the reader through what you have concluded from the results. What is the broader significance? Would anyone be mildly surprised? Why should anyone care? This section should refer back the main gap referred in the introduction. If you didn’t mention a research gap in the introduction, go back and fix that -- your poster should have made a good case for why this experiment was worthwhile. A good conclusion will also refer to the literature on the topic . For example, how does your research add to what is already published on the topic? Table 1.Captions to be set in Times or Times New Roman or equivalent, italic, 18 to 24 points, to the length of the column in case a figure takes more than 2/3 of column width.