Download
1 / 63
630 likes | 765 Views
Join us for a comprehensive introduction to government microdata, including large-scale cross-sectional datasets from major UK surveys and the Census. This hands-on session will cover data sources, availability, and how to access datasets through Nesstar. Topics include the types of anonymised records, data quality, and practical uses in research, such as examining societal trends and comparing sub-populations. Learn more about the collaboration between the University of Manchester and the UK Data Archive through the Economic and Social Data Service.

E N D
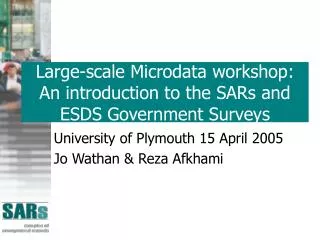
Introduction to Government Microdata Large-scale cross-sectional microdata from government surveys and the Census Sept 05: University of Edinburgh Economic and Social Data Service – Government Specialist Service Samples of Anonymised Records Support Unit University of Manchester
Plan for today • General introduction to data sources • What’s available • How to get it – hands on session with Nesstar • Jo Wathan & Reza Afkhami (ESDS Government / SARs support unit) • Working with survey microdata • Sampling issues • Web materials • Gillian Raab (PEAS, University of Napier) • Working with the Samples of Anonymised Records • File types • Quality • Data issues • Jo Wathan
Who we are • ESDS Government is a collaboration of CCSR at the University of Manchester and the UK Data Archive • http://www.esds.ac.uk/government • CCSR also is the home of the SARs support Unit • http://www.ccsr.ac.uk/sars • Both services are there to help users! We: • Disseminate • Operate a helpdesk • Provide web pages and access • Produce documentation • Organise user groups • Run new lists • Run training and other events
What data are we talking about? • Census microdata • Samples of Anonymised Records; 01 & 91 • Major cross-sectional data series collected by the Office for National Statistics (ONS) and National Centre for Social Research (NatCen) such as: • General Household Survey • Labour Force Survey • Expenditure and Food Survey • Health Survey for England/Scotland • British Crime Survey • Family Resources Survey
The data we’re not talking about… • Aggregate data • Good for population data • E.g. Census tabular data (CDU) • International time series data (ESDS International) • Longitudinal data • Good for looking at micro-level process • Eg. Longitudinal Study (CeLSius) • British Household Panel Study (ESDS Longitudinal) • International microdata (ESDS International) • Other less well known /one-off studies (ESDS Core)
To find out more about other sources… • Census data: http://www.census.ac.uk • Economic and Social Data Service has 4 specialist services • Government (that’s us!) • Longitudinal • International • Qualidata • Plus ‘core’ function for other datasets held at the UK Data Archive http://www.esds.ac.uk
What is the data like? • Sample data • Microdata • Nationally representative within UK – some files cover only part of the UK • LFS is UK-wide • GHS is GB only • SHS is Scotland only • Cross-sectional data • Most surveys are continuous • Many files are heirarchical • Allow linkages to be made between members of the same household/family (for example)
Quality of Data (1) • Two main data collectors: • Office for National Statistics (ONS) • NatCen • Both have considerable experience • Census has been running since 1801! • ONS Social Surveys started in 1941 • Natcen founded in 1969 (as SCPR) • Social surveys have permanent panels of highly trained field interviewers • Census is self-completion – deal with data quality this afternoon • Management and Quality Checking • (Relatively) high response rates – but falling • Widespread use by secondary analysts
What would you use the data for? • Straightforward secondary analysis • To assess theoretical accounts • To quantify characteristics or behaviours • To challenge official views • To apply alternative definitions • Context to your own primary research • Your research could be quantitative or qualitative • To assess the national context of an area study • To assess whether your sample is typical • To assess the scale of behaviours
Practical research uses of the data • Looking at change over time • Look at sub-populations • Using the flexibility of the data to look at alternative definitions • Looking within households
Secondary analysis:change over time among sub-populations Marmot, M (2003)
Pros… Reasonable amount of comparability Can pool years/quarters Data is representative at each time point Good at looking at impacts on groups Cons… Limits to continuity in the data (e.g. ethnic group) Cannot establish individual change SAR data only has 2 data points ten years apart Using successive cross-sectional data over time
Looking at small populations • Largest sample sizes available with the Samples of Anonymised Records • Individual SAR has 1.8 MILLION records (3%) • Small area microdata file will have 5% • Many surveys with 10+k respondents • Permits minority groups to be represented • Rare subpopulations sample size may be too small… can consider combining years if appropriate
Decomposition of p(being in employment) using the SARs Ken Clark & Stephen Drinkwater, paper at SARs user group 2005
Combining datasets to increase sample size • Survey data is subject to sampling error! • Example: Pregnancy and Employment • Using 1998-99 General Household Survey data alone there are only 168 pregnant women aged 16-49 • 95% Confidence interval for % pregnant women economically inactive 34.2 – 49.1% • Combined 3 years’ data to obtain sample of 465 pregnant women • Confidence interval using 3 years’ data: 34.9 – 43.9%
Using the flexibility of the data to look at alternative definitions What are ‘hours worked’? • Is it just paid work? Or unpaid as well? • Hours usually worked, or actually worked last week? • In main job, or in any job? • What about students? • Overtime – paid? • Overtime – unpaid? • Lunch hours? • Do non-workers work zero hours or should they be excluded?
Use the hierarchy to… • Better describe the household • Describe the household context of an individual • Look at intra-household differences (& sameness)
Source: Richard Dickens, Paul Gregg and Jonathan Wadsworth (2000) ‘New Labour and the Labour Market, CMPO Working Paper Series 00/19 Table 5
Ethnic homogeneity -% hhold members in same ethnic group as HOH Source 1991 Household SAR C. Holdsworth and A. Dale
Choosing a dataset for research • Is secondary analysis appropriate? • And has someone already done the analysis for you? • Check published reports. • Is population data available? • If data is available for 100% of your population of interest this is preferable to sample data. • Which datasets cover your main topic? • Which other topics are you interested in? • Measurement over time • Geography • Respondents – whole household, children? • Sample size • This information will be in the documentation • To help with the decision • ESDS/SARs Getting Started guides • ESDS topic guides
Documentation • Is available online • Don’t need to be registered • Should contain • Information about method/sampling • Codebooks • Information about derived variables • Questionnaires • UNLESS YOU CAN TRACK YOUR VARIABLE BACK TO THE QUESTIONNAIRE TO ESTABLISH WHAT WAS ASKED TO WHICH RESPONDENTS YOU ARE UNLIKELY TO UNDERSTAND YOUR RESULTS!!!!
Accessing the data • Free to academics • Can directly download the data in SPSS, Stata or tab delimited formats • Can explore many datasets in the Nesstar tool • Most datasets simply require you to register with the Census Registration System – then go to the appropriate website. • Some datasets are more restricted: • Household SAR ’01 and Annual Population Survey are available to analyse on your desktop but you need to sign a special license • There is a more detailed version of the SARs data which contains information like LA area, individual year of age called the Controlled Access Microdata Samples (CAMS). Need to apply to use these at an ONS site.
The Licence • All users need to be licensed • Academics complete license as part of the Census Registration System Process • Non-academic users sign license as part of the data registration process • Cannot pass the data to an unlicensed user • Cannot attempt to identify an individual
The licence – good practice • Keep your data password protected • Destroy your data when you have finished using it • Remove SAR files before passing on your PC to someone else • Tell CCSR about your publications • Tell CCSR if you leave your institution
Access Arrangements • Inidividual licensed SAR and SAM Data distributed by CCSR • Others distributed by UK Data Archive • Academics, no charge • Register for the data under Census Registration System • Access the data online from CCSR or ESDS website • SAR charges for non-academics • Not for profit £500 per file • Business users £1000 per file • 10 users per application, incl. software • Download End User License from web
Accessing the data • Non-academic users • Data available in NSDstat • Other formats available on CD • Can arrange direct download • Academic users • Direct download (SPSS/Stata/tab delimited) • Nesstar, explore online and subset (wider range of formats available) • NSDstat available
Nesstar • No licence required • Designed as a data exploration and download tool – not fully fledged analysis package • Will produce graphics and exploratory analyses • Can do OLS • Useful way of getting into data if teaching • Cannot derive additional variables or recode • Principally use to subset and explore data before downloading to desktop