Download
1 / 24
300 likes | 516 Views
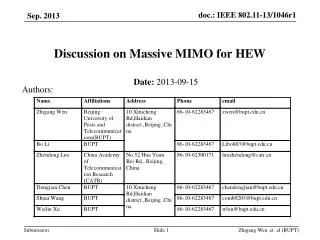
Master Thesis. A Study on Improved Algorithm for MIMO Antenna Measurement. Thanh-Ngon Tran Supervisor: Professor Kyeong-Sik Min. SRANT Laboratory, Korea Maritime University November, 2006. Contents. Chapter 1: Introduction

E N D
Master Thesis A Study on Improved Algorithm for MIMO Antenna Measurement Thanh-Ngon Tran Supervisor: Professor Kyeong-Sik Min SRANT Laboratory, Korea Maritime University November, 2006
Contents • Chapter 1: Introduction • Chapter 2: Algorithm of antenna measurement software with noise reduction • Chapter 3: Measurement of key parameters of MIMO antenna • Chapter 4: Design of multi-band MIMO test-bed • Chapter 5: Conclusion
Wireless LAN Mobile phone Home/office systems Voice/Data High Data rate Voice Multi-media Cordless phone Introduction (1) Chapter 1 Antenna development vs. Antenna measurement system Channel capacity increase Multiple Antenna Single/Multiple Antenna Single Antenna Single Antenna
Improve single antenna measurement software Apply the improved mea. software for MIMO ant. mea. Design 22 MIMO testbed for MIMO measurement Future works Introduction (2) – The goal and limitation Chapter 1 • The goal: Develop measurement software & system for MIMO antenna & channel measurement. Steps: (1) (2) (3) (…) Gain, 2D/3D pattern, Polarization, w/ Filter algorithm Direct up/down converters, Software structure and algorithm MIMO antenna and channel characterization Diversities, Correlation, Mutual Coupling
Single antenna measurement system Chapter 2
Ref.: Young-Hwan Park, “A study on construction of antenna measurement environment,” Master Thesis, Korea Maritime University, Feb. 2005 Previous Software vs. New Software Chapter 2 • There are two independent programs • Gain • Radiation Pattern • This program is not divided in specific functions • Simple structure • When there are changes, whole program have to be changed • The program can be modified easily when equipment is changed. • 4 measurement functions: gain, 2D and 3D pattern, polarization. • New algorithm for noise reduction
Software structure Software flowchart Software algorithm Chapter 2
TX Ant AUT 4m TX-RX Antenna in anechoic chamber Chapter 2 For experimental measurement: TX Ant.: Horn antenna, 1-18 GHz RX Ant.: Helical antenna, ~ 3 GHz Distance: ~4 meter
Measurement Results with filter algorithm Chapter 2 Signal processing algorithm Original Signal (pattern) Measured by conventional measurement system Filtered Signal (pattern) Measured and processed real-time by noise reduction algorithm
Noise Reduction Algorithm Chapter 2 • Combination of time and space mean filter • Noise in measurement system is Additive White Gaussian Noise (AWGN) • Mean filter is suitable for removing AWGN Measured Power Expected Power Noise Time Mean Filter Space Mean Filter
#2 #3 z #1 #4 110 mm y x 7 mm 75 mm MIMO antenna measurement Chapter 3 This EUT is chosen because it is: • One of MIMO appli-cation. • Elements have differ-ent polarization, pattern, gain, coupling … Measure and evaluate: • Diversities: pattern, polarization. • Pattern correlation. • Mutual coupling. (a) Front view (b) Inside view Metal box, PDA-size with 4 IFA antennas (PDA: Personal Data Assistant)
x x y y z z Gain of antenna elements on x-y plane Gain of antenna elements on x-z plane Gain of antenna elements on y-z plane Pattern (gain) diversity Chapter 3 #3 is the best choice #1 is the best choice #4 is the best choice #2 is the best choice • Maximum gain of EUT antenna elements on three planes is about 6 dBi (y-z plane). • In any direction, there is at least one element with high gain. Difference between the highest and lowest gain is higher than 3 dB at any direction. • Conclusion: This difference of gain pattern shows good gain diversity.
x x x x y y z z Polarization diversity Chapter 3 Element #2, x-y plane XPD = 20dB @ 89o Element #1, x-z plane XPD = 22dB @ 178o Element #3, x-y plane XPD = 20dB @ 268o Element #4, x-z plane XPD = 20dB @ 183o Eco and Ecross are co-polarization and cross-polarization components of E-field, respectively. • Element #1 and #4: linear horizontal polarization. • Element #2 and #3: linear vertical polarization. • Conclusion: Good the polarization diversity.
x x y y Element #3, x-y plane Element #2, x-y plane Pattern Correlation Chapter 3
Mutual Coupling Measurement Chapter 3 EUT MW Receiver & Freq. converter
MIMO Testbed Chapter 4 Block diagram of 22 MIMO testbed • Freq.: 1.8 – 5.8 GHz • Use direct-conversion technique for analog RF circuits • RF analog circuits are coupled with DSP algorithm
Design the wide bandwidth direct down-conversion receivers by: Combine the analog front-end circuit with base-band DSP Freq.: 1.8 – 5.8 GHz 3 Analog front-end Baseband DSP RF LO 1 2 Bandwidth is Wider Q I Power div. Mixer Phase shifter Analog front end circuit is simpler Baseband Amp. RX - Design of Down-converter Chapter 4
5% amplitude imbalance Conventional bandwidth: 0.25 GHz (5o imbalance) Imbalance parameters Chapter 4
Measured sig. Processed sig. Reference sig. Measured sig. Processed sig. Reference sig. V_I (Volts) V_I (Volts) V_I (Volts) Measured sig. Processed sig. Reference sig. Frequency: 4.0 GHz Amp. imbalance: 1.118 Phase imbalance: -13.25 degree Frequency: 1.8 GHz Amp. imbalance: 0.898 Phase imbalance: -75.74 degree Frequency: 5.6 GHz Amp. imbalance: 1.125 Phase imbalance: 44.50 degree V_Q (Volts) V_Q (Volts) V_Q (Volts) Lissajuos graph of the I and Q signal at 1.8 GHz Lissajuos graph of the I and Q signal at 4.0 GHz Lissajuos graph of the I and Q signal at 5.6 GHz RX - I/Q signals Chapter 4
LO RF Power combiner Q I Mixer Phase shifter Up converter circuit Measurement setup TX - Design of Up-converter Chapter 4 • Analog front-end circuit is coupled with DSP algorithm to compensate the imbalance characteristics of analog circuit (as in down converter). • LO leaky is controlled by bias voltage on MIXER chips.
Leaky signal suppression Chapter 4 Suppressed by controlling amplitude and phase coefficient Suppressed by controlling bias voltage on MIXER chips Spectrum of output signal before and after imbalance compensation
I-Channel: 0.402VDC + 0.142Vac, phase = 0o Q-Channel: 0.308VDC + 0.150Vac, phase = 112.3o I-Channel: 0.239VDC + 0.120Vac, phase = 0o Q-Channel: 0.638VDC + 0.122Vac, phase = 73.9o Spectrum of output signal without I/Q imbalance compensation at 3.0 GHz Spectrum of output signal with I/Q imbalance compensation at 3.0 GHz Spectrum of output signal without I/Q imbalance compensation at 5.0 GHz Spectrum of output signal with I/Q imbalance compensation at 5.0 GHz Measurement results of output spectrum Chapter 4
Conclusion and future study • Development of measurement software & system for MIMO antenna & channel measurement is divided into 3 steps with the good experiments results: • Improve single antenna measurement software: • Gain, 2D/3D pattern, polarization with noise reduction. • Apply the improved measurement software for MIMO antenna measurement: • Diversities, Correlation, Mutual Coupling. • Design 22 MIMO testbed for MIMO measurement. • Direct up/down converter, system design. • Future study: Develop algorithm for MIMO antenna and channel characterization.