Download

1 / 18
210 likes | 405 Views
Behavioral Finance and Asset Pricing. What effect does psychological bias (irrationality) have on asset demands and asset prices?. 1. We want to employ an intertemporal choice model to evaluate the effect of psychological bias on consumption and portfolio choices.

E N D
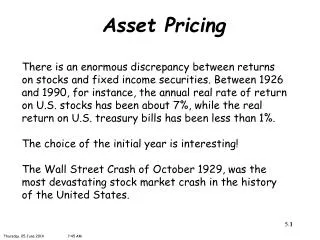
Behavioral Finance and Asset Pricing What effect does psychological bias (irrationality) have on asset demands and asset prices?
1. We want to employ an intertemporal choice model to evaluate the effect of psychological bias on consumption and portfolio choices Barberis, Huang and Santos (2001): Under prospect theory we can identify two forms of psychological bias - - • loss aversion – investors are more sensitive to recent losses than they are to recent gains in wealth • house money effect – the sequencing of losses and gains has an effect on investor behavior, so that after a recent run-up in asset prices (gains) investors become less risk averse (gains “cushion” losses)
Premise of the BHS model: • investors derive direct utility from consumption and changes in the value of financial wealth. • investors care about fluctuations in financial wealth whether or not they are correlated with consumption. • investors have time-varying risk aversion due to loss aversion from financial wealth fluctuations Implications of the BHS model: • asset prices exhibit greater volatility than they would based solely on changes in fundamentals (earnings). • asset prices and returns become more predictable. • high equity risk premium (“excess volatility” in asset prices leads risk averse investors to require a higher rate of return on stocks).
BHS model economy 1(Lucas 1978 model where consumption is equated to dividends, so that stocks are a claim on future consumption) Technology • A portfolio of risky assets has return (Rt+1) and pays a stream of dividends (Dt). In equilibrium aggregate consumption (Ct) equals dividends plus nonfinancial income from labor (Yt). Both dividends and nonfinancial income are perishable. The risk-free asset has rate Rf,t . • Aggregate consumption and dividends follow a joint lognormal process where the error terms ~ i.i.d. N(0,1) as
Preferences • Infinitely lived individuals maximize their lifetime utility where γ < 1 is the risk aversion coefficient, ρ is a time discount factor, St is the value of risky asset at date t, Xt+1 is the total excess return from holding the risky asset (relative to the return on the risk-free asset), bt is a “scaling” parameter. zt is a state variable. It is the individual’s prior gains (losses) as a fraction of St. zt = Zt/St where Zt is the historical “benchmark” level of stock price that is identified by the investor. zt < 1 indicates a prior gain occurred, zt > 1 indicates a prior loss occurred. zt follows a process where 0≤η≤1 and the average R makes zt = 1 in steady state. With larger η the investor’s memory is longer.
The function v ( ) characterizes the prospect theory effect of risky asset gains on utility. • If zt = 1 (no prior gains or losses) we get pure loss aversionwhere λ > 1 and losses have a bigger effect on utility. • When zt ≠ 1 the v( ) function reflects the house money effect. • If zt ≤ 1 (prior gains) the v( ) function becomes, Interpretation of (15.7): When a return exceeds the cushion built in by prior gains (Rt+1 ≥ ztRf,t) the effect on utility is 1:1. When the gain is less than the amount of prior gains (Rt+1<ztRf,t) the effect on disutility is greater than 1:1.
If zt > 1 (prior losses)) the v( ) function becomes where λ(zt) = λ + k(zt -1) and k > 0. Losses that follow previous losses are penalized at the rate λ(zt), which exceeds λ and grows larger as losses become larger (as zt >1). • The prospect theory term, v( ), is scaled by bt to make the risky asset price/dividend ratio and the risky asset risk premium stationary as wealth increases over time.
Prospect theory effect of risky asset gains and losses on utility
2. We want to solve the model to show that an equilibrium exists • The state variables of the consumption-portfolio choice model are wealth (Wt) and zt. • Assume that the ratio of asset price/dividend is a decreasing function of zt where ft = Pt/Dt = f(zt). We want to show that an equilibrium exists where that is true. • Assuming that Rf is constant, we can write the return on the risky asset as • From (15.7) and (15.8) we can verify that v( ) is proportional to St. Thus, v(Xt+1, St, zt) can be rewritten as Stv(Rt+1, zt). If zt < 1 (prior gain)
and for zt >1 (prior loss) Then the individual’s maximization problem is subject to the budget constraint in (15.14) and the dynamics for zt in (15.5)
Bellman equation Define ρtJ(Wt, zt) as the derived utility of wealth function. Then we can write the Bellman equation as Taking the first-order conditions of (15.15) w.r.t. Ct and St we get (15.16) and (15.17)
From (15.16) and (15.17) we can derive the envelope condition (see handout) Substituting this into (15.16) we obtain the Euler equation What are the economic interpretations of (15.18) and (15.19)? Using (15.18) and (15.19) in (15.17) we get or
Equilibrium • In equilibrium we can replace the representative agent’s consumption Ct with the aggregate level of consumption, . • Then, under the assumption that aggregate consumption is lognormally distributed, we can also solve for the risk-free interest rate: Using (15.1 ) and (15.10) we can simplify (15.21) to or
Numerical solution algorithm • (15.24) and (15.25) need to be solved jointly. BHS use an iterative numerical technique to solve for f ( ), by guessing at f 0( ), solving for zt+1 in (15.25), finding a new solution f 1( ), and using the following recursive equation until the f i( )function converges to an equilibrium.
Selected parameter values • gc = 1.84%; σc = 3.79%; γ = 1.0; ρ = 0.98 jointly imply that Rf -1 = 3.86% ( a low risk free rate) • λ = 2.25(indicates how keenly losses are felt relative to gains, w/o prior losses or gains (Tversky & Kahneman, 1972) • k = 3(the penalty parameter to reflect how much more painful losses are if they come after other losses) – chosen to either: 1) get λ close to 2.25 or 2) to bring the equity risk premium close to its empirical (historical) value. • b0 = range (0.7 – 100) (determines the relative importance of the prospect theory term in the investor’s preferences over financial wealth fluctuations)
Summary of Results • BHS find that Pt/Dt = ft(zt) is a decreasing function of zt. If there are prior gains from investing in the risky asset (and zt is low), the investor becomes less risk averse and bids up the price of the risky asset. • Using the estimated f( ) function, we can simulate the unconditional distribution of stock returns from the random sequence of εt. The resulting volatility of stock prices can be substantially higher than that of the aggregate consumption series. • Then, due to loss aversion, the model generates an equity risk premium that will be significant for relatively low levels of risk aversion, even if stocks do not have a high correlation with consumption (recall that a low covariance suggests a low equity risk premium in the standard consumption asset pricing model) . • The BHS model also implies predictability of stock returns - - returns are higher following stock market crashes and smaller following expansions. Therefore, stock returns are negatively correlated at long horizons.