Download

1 / 47
470 likes | 622 Views
Survey on Attitudes and Perceptions about the Potential Use of Catch Shares in the Puerto Rican Deep-Water Snapper-Grouper Fishery. J. Agar Caribbean Fishery Management Council St. Thomas, U.S. Virgin Islands March 29-30, 2011. Objectives of the presentation.

E N D
Survey on Attitudes and Perceptions about the Potential Use of Catch Shares in the Puerto Rican Deep-Water Snapper-Grouper Fishery J. Agar Caribbean Fishery Management Council St. Thomas, U.S. Virgin Islands March 29-30, 2011
Objectives of the presentation • Introduce contents of proposed data collection • Discuss methods • Timeline • Seek feedback from fishery managers regarding the content and scope of data collection.
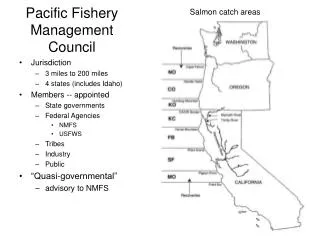
Deep-water snapper-grouper fishery • In 2009, the fishery yielded about 0.67 million lbs valued at $2.1 million. • Silk and Queen snappers accounted for 66 & 27 percent of the revenues. Other species: Black, Blackfin, Vermilion, Cardinal snappers, Wenchman & Misty, Yellowedge, Black and Yellowfin groupers • Prosecuted by hook and line and trap gears. • Most of the fishery is concentrated in the West coast
The survey intends to collect information on • Socio-demographics and vessel information • Attitudes and perceptions about the proposed program • Preferences about program design • Cost and earnings
Attitudes and perceptions about the use of catch shares • Perceived issues/problems in the dw snapper-grouper fishery • Familiarity with CS program • Support/Opposition to CS program (and reasons) • Expectations about performance of CS program • Changes in dockside prices and harvesting costs • Reduce overcrowding and improve efficiency • Improve safety at sea • Reduce by-catch and enhance stocks • Outreach and education (needs)
Preferences about the design of a catch shares program • Initial allocation of quota • Eligibility of participants • Qualifying criteria • Minimum quota requirement to remain commercially viable • Transferability (Purchase/Leasing) • New entrant quota fund • Suggestions for quota monitoring
Costs and Earnings • This information will be used to develop models that • estimate • share and allocation (lease) prices, and • benefits and costs of management proposals
Willingness to pay for quota Price of fish ($/lb) Price & cost ($/lb) Marginal cost ($/lb) Catch Willingness to pay for quota ($/lb) “Expected extra profit from harvesting one more unit of quota” ($/lb) Catch
Pricing of Catch Shares leases Quota WTP $/lb WTP $/lb WTP $/lb Pmkt + = Catch Catch Catch QMkt= Q1+Q2 Q2 Q1 Boat A Boat B Fleet
Firm’s response to CS prices WTP ($/lb) Pimplicit Pmkt Market lease price QInitial Q* Quota ΔQ=Buy
Firm’s response to CS prices WTP ($/lb) Pmkt Market lease price Pimplicit Catch Q* QInitial ΔQ=Sell
Methods • In-person interviews (40-60) • Stratified random sample by production levels • Sampling frame: d.w. s&g licensed fishers
Final report (March 2012) Federal Register Notice (October 2010) Data entry & analysis (December 2011) Council Review & Pre-test (April 2011) OMB Submission (May 2011) Fieldwork (September 2011) Timeline of project
Thank you for listening… • Any comments, suggestions for improving content • and clarity of instrument ???
Consideration in designing ITQs • Qualifying criteria • Initial allocation of quota • Transferability and accumulation • Sunset or duration • Re-evaluation of performance • Enforcement • Cost recovery and fees
Benefits of ITQs • Prevents or mitigates race to fish (2-3 day seasons in halibut fishery) • Market dictates supply of product (no market gluts, longer seasons, higher prices, good quality) • Incentives to protect resource • Safety at sea • Reduces by-catch and wastefulness • Gear conflicts reduced • Reduce fleet overcapacity
Concerns with ITQ • Initial allocation of quota shares • Industry acceptance • Quota busting (community culture and attitudes, social sanctions, monitoring and enforcement may limit this adverse impact) • Misreporting of landings (data fouling) • High-grading • Multispecies fisheries (lack of selectivity leads to by-catch and discards) • Residual catch management (salmon escapement-catch must taken up few hours, days- ITQ may be impractical) • Unstable, short-lived species (hard to know biomass with certainty over time-large capacity to “mop” up catch may be necessary) • Real time monitoring of landings (expensive) • Enforcement and reporting (cheating, multiple ports) • Consolidation of shares • Social impacts (changes in communities and harvesting and processing communities) • Reduction in fleet size and employment (e.g., • SCOQ: 128 to 53 vessels and 30% ↓ employment • BC halibut: 32% ↓ employment • Remuneration of crew decreases to reflect cost of purchasing ITQ (or its opportunity cost). • Increased management costs.
Industry acceptance • Plans to allocate access rights and/or harvest • rights to a limited group have often met strong • opposition. • The reason being that the alteration of existing • fishing privileges ~ entails a specific distribution • of benefits advantaging certain participants over • others.
Conflicts • Equity and accepted rules of fairness : “equal • opportunity to use skills”. The reward is a • function of skills, which is perceived as fair • (input over output controls) • Rent seeking: ability to make (wealth) allocation • decisions is inversely related to the degree of • vested interests in the fishery (young vs. old • fisheries, high capital vs. low capital).
Program description Implementation date: January 1st, 2007. Objectives: Amendment No. 26 to the GOM Reef fish FMP developed the IFQ program to: a) reduce overcapacity, and b) eliminate, to the extent possible, the problems associated with derby fishing.
1984: Reef Fish FMP: 13’ TL 1992: - Emergency rule (53 day season); - Amend # 4: Moratorium of new permits 2007: IFQ 1990: Amend # 1: 3.1 mp TACC 1993: Endorsements: 2,000 and 200 lbs 1995: Amend # 8: IFQ Attempt (Congress repeal) 2000: Reg Amend: 10 day mini-seasons 45% Cut
Snapper Silk snapper Queen snapperBlackfin snapper Wenchman Cardinal snapper Black snapper Vermilion snapper Grouper Misty grouper Yellowedge grouper Black grouper Yellowfin grouper
Red Snapper IFQ Design Features • Eligibility: U.S. citizens or resident aliens with Class I and Class II (200 lbs red snapper trip allowance) licenses. • Initial allocation: shares proportional to landings over qualifying period. • Class I license holders: 10 best consecutive years from 1990-2004. • Class I historical captains license holders: 7 years from 1998-2004. • Class II license holders: best 5 years from 1998-2004. • Transferability: IFQ shares and allocations can only be transferred to individuals and/or vessels with commercial reef fish permit during first 5 years. U.S. citizens and resident aliens thereafter. • Accumulation cap: 6.0203% of total shares. • Dealer endorsement • Cost recovery: 3% of reported red snapper revenue
Reasons for not implementing “preferred” metrics: • Data gaps: • Tracking crew dynamics • Limited information on wholesale and retail sector (e.g., product flows, prices) • Resource short-comings: • Quality issues with certain IFQ variables (mainly lease and allocation prices, but also dockside prices->cost recovery) • Quality issues with permit files (e.g., vessel characteristics) • (Potentially) need to beef up current cost and earnings data collections that rely on sampling segments of the fleet because as fleets becomes rationalized (smaller) the probability of a statistically valid representation of the IFQ segment decreases. • Too much FTE effort devoted to data collection rather than analysis • Research gaps: • Tracking community impacts.
Parting Thoughts • Cursory review of the performance of the IFQ revealed preliminary success in meeting the set objectives. However, the collection of some of the proposed performance metrics may need to be strengthened. • Development and monitoring of performance measures are (and should not take the place of) in-depth formal assessments, which probably should take place in 5-10 year intervals. • Regions have multiple research management responsibilities which go beyond catch shares. Furthermore, many regional fisheries may not be good candidates for the catch shares.Therefore, greater attention to catch shares will require more resources (particularly FTE) for data collection and monitoring and, more importantly, applied research.
Developing instruments to understand fishermen’s perceptions about the effectiveness of the program and ascertain the validity of the figures described. • Two-prong approach: • Propose in-person interviews w/major stakeholders, primarily former Class I permit holders and ‘recent’ IFQ share holders • Propose mail and/or telephone interviews with Class II permit holders and folks who recently exited the fishing industry altogether.
IFQ Impact on Dockside Prices (Logbook) (O) Overage(U) Underage
Council submits IFQ program • IFQ moratorium until Oct. 2000 • 2001-2003 Council develops IFQ profile • 1st referendum to proceed with IFQ • development passes (82% approval) • 2004-2006 AP and Council develop Amendment 26 • 2006 2nd referendum approves IFQ program (87% approval) • 2007 IFQ program implemented
Efficiency Scores: Output Orientation Assessment • Model Assumptions: • Trip level for 2006-2008 • Inputs: vessel length, HP, and vessel hold, days at sea, crew size, and number of gear • Outputs: 7 species groupings (red snapper, vermillion snapper, other mid-water snappers, shallow water groupers, deep water groupers, and residual group) • Stock abundance ignored
Share Concentration Indexes Gini Coefficient (inequality distribution) G= 1- Σ(Yi+1+Yi)(Xi+1-Xi) Gini range: 0 – 1 (perfect equality – perfect inequality) Herfindahl-Hirschman Index (market concentration) HHI = s1^2 + s2^2 + s3^2 + ... + sn^2 (where sn is the market share of the ith firm). HHI range: 0 - 10,000 (perfect competition- monopoly) Theil’s Entropy Measure T=Σsi [log (si)-log(1/n)] (where s is the share of ith firm share, n is the number of firms)
Allocation (lease) Transactions • Self reporting of allocation prices are questionable ($/lb 2.50). • The number of transfers and overall volume suggests the presence of an active market *Non zero prices **Apparent different entities
Share (perpetuity) Transfer Transactions • Share prices as allocation prices are highly suspect. Market prices oscillate between $10-15 lb of share. • Decreasing number of transactions and lower volume suggest that industry is consolidating. *Non zero prices **Apparent different entities
The goal of this study is to investigate the • economic performance of the individual fishing • quota (IFQ) program in the Gulf of Mexico red • snapper fishery. • Amendment No. 26 to the GOM Reef fish FMP • implemented IFQs to • a) reduce overcapacity, and • b) eliminate, to the extent possible, the problems associated with derby fishing.
Outline • Goals and motivation of study • Overview of Fishery • Share Preliminary Trends on the Performance • of the GOM Red Snapper IFQ Program • Discuss future work
Cost Recovery Fees • MSA requires Secretary to recover actual costs of managing and enforcing the IFQ program • 3% of the ex-vessel value of landings • 2007: $ 303,816 ($ 10.14 m ex-vessel revenue) • 2008: $ 247,815 ($ 8.26 m ex-vessel revenue)
Self reported number of fish discarded per trip for those that landed red snapper