Download
1 / 11
110 likes | 189 Views
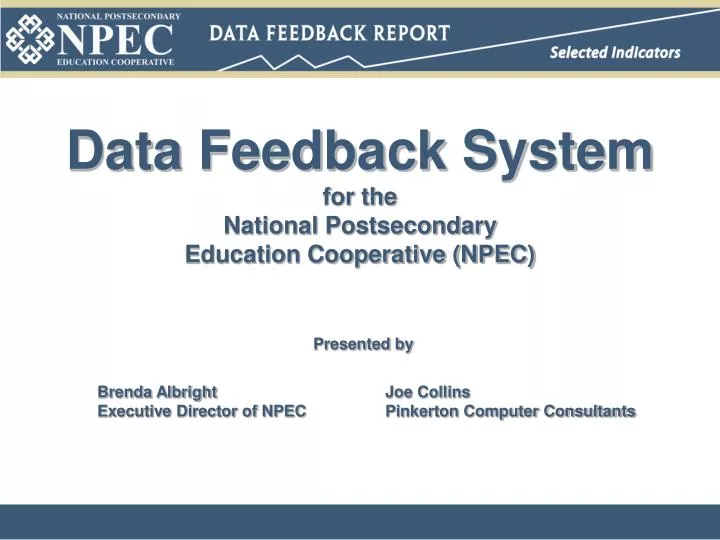
Data Feedback System for the National Postsecondary Education Cooperative (NPEC). Presented by Brenda Albright Joe Collins Executive Director of NPEC Pinkerton Computer Consultants. Data Feedback Project Goal #1.

E N D
Data Feedback Systemfor the National Postsecondary Education Cooperative (NPEC) Presented by Brenda Albright Joe CollinsExecutive Director of NPEC Pinkerton Computer Consultants
Data Feedback Project Goal #1 • 1. Develop an application that will dynamically create Institution Indicator Reports based on IPEDS Staff, Finance, Completion and Enrollment data.
Data Feedback Project Goal #2 • 2. Report data specific to the institution, as well as data from a Comparison Group of institutions based on Carnegie Code, Control Number, Region,Enrollment Size and Geography. Example: San Francisco State University Carnegie Code = 21 (496 institutions) Control = 1 (249 institutions) Region = Southwest and Far West (58 inst.)
Data Feedback Project Goal #3 3. Distribute Institution Indicator Reports to institutions via Email and US Postal Mail.
IPEDS Data Sources/Collections 1. Institutional Characteristics Directory and general information about each institutions – for Carnegie classification and control values. Collected in the Fall. 2. Fall Enrollment Institutional enrollment as of October 15, by enrollment status, level, race/ethnicity and gender of student. Collected in the Spring. 3. Staff Institutional employees by occupational activity, race/ethnicity and gender. Collected in Fall of odd-numbered years. 4. Finance Institutional revenues, expenditures and other financial information. Collected in the Spring. 5. Student Financial Aid The number and percent of full-time, first-time, degree/certificate-seeking undergraduate students receiving student financial aid, by type of aid. Collected in the Spring.
Comparison Groups 67 Comparison Groups Smallest Group = 5 institutions Largest Group = 91 institutions Average Group = 39 institutions
Questions and Discussion Joe Collins Pinkerton Computer Consultants Alexandria, Va. collinsj@pcci.com