Download
1 / 24
250 likes | 384 Views
Automated Detection of Influenza Epidemics with Hidden Markov Models. Toni M. Rath, Department of Computer Science University of Massachusetts at Amherst, MA 01003 USA Maximo Carreras Paola Sebastiani Department of Mathematics and Statistics

E N D
Automated Detection of Influenza Epidemics with Hidden Markov Models Toni M. Rath, Department of Computer Science University of Massachusetts at Amherst, MA 01003 USA Maximo Carreras Paola Sebastiani Department of Mathematics and Statistics University of Massachusetts at Amherst, MA 01003 USA IDA 2003 pp. 521-532 Intelligent Data Analysis
Introduction • Influenza can lead to serious complications such as bacterial pneumonia and, for the elderly or immunocompromised patients, influenza can be fatal. • Because early detection of influenza epidemics could have a serious impact on the number of lives saved, great emphasis has been placed on influenza surveillance by monitoring indicators of the spread of epidemics. 細菌的 肺炎 免疫功能降低的
Introduction • The current approach to influenza surveillance is based on Serfling’s method. -uses cyclic regression to model the weekly proportion of deaths from pneumonia and influenza -define an epidemic threshold that is adjusted for seasonal effects [R. E. Serfling. Methods for current statistical analysis of excess pneumonia-influenza deaths. Public Health Reports, 78:494–506, 1963.]
Introduction • several authors have proposed to use other indicators of influenza epidemics, such as the proportion of patient visits for influenza like illness (ILI) that should provide earlier indications of an influenza epidemic. [L. Simenson, K. Fukuda, L. B. Schonberg, and N. J. Cox. The impact of influenza epidemics on hospitalizations. The Journal of Infectious Diseases, 181:831–837,2000.] [F. C. Tsui, M. M. Wagner, V. Dato, and C. C. H. Chang. Value ICD-9-Coded chief complaints for detection of epidemics. In Proceedings of the Annual AMIA Fall Symposium, 2001.]
Introduction • Although applied to different data, the detection is still based on cyclic regression and suffers from several shortcomings • the need for non-epidemic data to model the baseline distribution • the fact that observations are treated as independent and identically distributed [L. Wang, P. Sebastiani, J. Tsimikas, and K. Mandl. Automated surveillance for influenza pandemics. Technical report, Department of Mathematics and Statistics. University of Massachusetts at Amherst., 2003. Submitted.532 T.M. Rath, M. Carreras, and P. Sebastiani] [P. Sebastiani and K. Mandl. Biosurveillance and outbreak detection using syndromic data. In Data Mining: Next Generation Challenges and Future Directions. AAAI/MIT Press, 2003. In press.]
Introduction • Recent work suggested the use of Hidden Markov Models to segment time series of influenza indicators into epidemic and non-epidemic phases. [Y. LeStrat and F. Carrat. Monitoring epidemiologic surveillance data using hidden Markov models. Statistics in Medicine, 18 (24):3463–78, 1999.] [L. R. Rabiner. A tutorial on Hidden Markov Models and selected applications in speech recognition. Proceedings of the IEEE, 77:257–285, 1989.] • There are two advantages in this approach: • applied to historical data without the need for distinguishing between epidemic and non-epidemic periods in the data • the observations are supposed to be independent given knowledge about the epidemic, whereas Serfling’s method assumes marginal independence of the data
Introduction • the authors in [6] suggest using a mixture of Gaussian distributions to model the ILI rates and demonstrate the detection accuracy using a data set of historical data collected between January 1985 and December 1996 from a sentinel network of 500 general practitioners in France. • We analyze the same data set and show that better detection accuracycan be achieved by modeling the data using a mixture of Exponential and Gaussian distributions. • The change of the underlying distributions removes the need for explicit modeling of trend and seasonal effects that can introduce systematic bias in the detection accuracy.
Serfling’s Method for Epidemic Detection • The current approach to influenza surveillance implemented by the Centers for Disease Control in the U.S. is based on Serfling’s method and the objective is to determine an epidemic threshold. • The method models the weekly number of deaths due to pneumonia and influenza by the cyclic regression equation. sine-wave component α sin(2πt/52) + β cos(2πt/52) models the annual recurrence of influenza epidemics t is noise which is assumed to have mean 0 and variance σ2 θt describes secular trend The parameter µ is the baseline weekly number of deaths, without seasonal and secular trends yt is the number of susceptible to deaths from pneumonia and influenza in week t, when there is no epidemic
Serfling’s Method for Epidemic Detection • Assuming that the errors are uncorrelated and normally distributed, the standard least squares method is used to estimate the model parameters µ, θ, α, β, σ2 from non-epidemic data, and to compute confidence bounds about the predicted values. • The predicted values are given by • The confidence bounds are then computed as The confidence bounds are used to define a time varying epidemic threshold that is adjusted for trend and seasonal effects. tα/2 is the (1 − α/2) percentile of a Student’s t distribution
Serfling’s Method for Epidemic Detection Serfling’s model
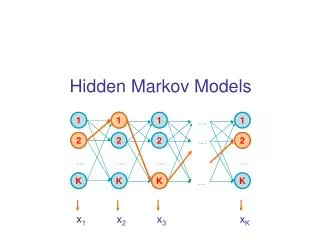
Hidden Markov Models • When applying the model to the data, there are two main objectives: • 1. Learning the model form the data; that is, estimating the model parameters from the data. This is achieved by maximum likelihood techniques using the EM-algorithm, known in the HMM literature as the Baum-Welch algorithm. • 2. Decoding the most likely sequence of hidden states that generated the data. This is done by means of the Viterbialgorithm.
Epidemic Detection Using Hidden Markov Models class class • Le Strat & Carrat proposed to detect epidemic and non-epidemic phases of influenza by modeling ILI rates with HMMs using a mixture of Gaussian distributions. • They focused on a 2-state model and parameterized the means using Serfling’s approach , so that the rates of both the epidemic and non-epidemic phases are modeled as in Equation observation
Epidemic Detection Using Hidden Markov Models • There are two main shortcomings to this approach: • Gaussian distribution for modeling the non-epidemic rates is inappropriate, because it assigns non-zero probability to the occurrence of negative incidence rates. • The model for the means, although rich in parameters, is quite rigid • little data will lead to an unreliable fit that would not extend well to future data • a large amount of data will yield bias and under/overestimation problems
Epidemic Detection Using Hidden Markov Models • To address these problems, we propose to use a 2-state HMM • non-epidemic rates are modeled with an Exponential distribution • Non-epidemic rates are always positive and approximately exponentially distributed. • epidemic rates with a Gaussian distribution • Unlike Le Strat & Carrat’s model, the means of the densities do not have any seasonal dependency count Non-epidemic ILI rate
Epidemic Detection Using Hidden Markov Models • Our model is simple and describes the data well, without the need for modeling seasonality and trend effects. It allows us to capture out-of-season, non-epidemic peaks, which tend to cause false detections in Le Strat & Carrat’s periodic model.
Evaluation • Le Strat & Carrat tested their model for epidemic detection on a time series of ili incidence rates in France from 1985 to 1996, collected by a network of sentinel physicians. • For reasons of comparability, we performed the evaluation of our model. • Le Strat & Carrat:periodic model • This paper:exponential model • Both models were implemented in Matlab • parameters estimated from the time series using the Baum-Welch/EM estimation algorithm • The updated parameters are then passed to the Viterbi algorithm, which extracts the most likely state sequence that generated the observed time series.
Evaluation • An ideal classification separates the data into two parts: • the non-epidemic, seasonal background pattern with low incidence rates • the epidemic periods with the pronounced peaks
Evaluation • Exponential model provides a more cautious classification than the periodic model. • it classifies a smaller number of weeks as epidemic weeks
Periodic Model Evaluation • periodic model often tends to detect epidemic periods too early and non-epidemic periods too late, such mistakes are very minimal with the Exponential model • Exponential model classified 10.40 weeks per year as epidemic, which is more realistic than 13.31 obtained with the periodic model. • In the periodic model, small peaks occurring outside the influenza season trigger classifications, The Exponential model performs much better in these situations. Exponential Model