Download
1 / 20
200 likes | 223 Views
Data Center & IT Solutions Group. Oceania User Conference May 7, 2008. Martin Otterson, OSIsoft Christian Luckock , OSIsoft. OSIsoft’s Market Focus and Experience. Data Center & IT Solutions Group. Energy consumption produces Computing

E N D
Data Center & IT Solutions Group Oceania User Conference May 7, 2008 Martin Otterson, OSIsoft Christian Luckock , OSIsoft
OSIsoft’s Market Focus and Experience Data Center & IT Solutions Group
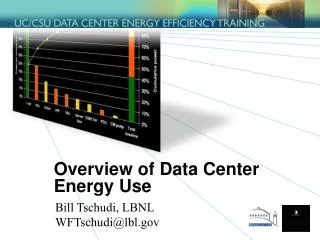
Energy consumption produces Computing Requires “holistic” monitoring for continuous improvement Efficient energy consumption with most profitable outcome Identify the bottlenecks Treat all individual systems- as ONE Mechanical, Power, IT , Security as a complete system Data Center Space- is the “Plant for IT”
What does the OSIsoft product address (in other words what’s the bottom line) In theU.S. Environmental Protection Agency ENERGY STAR Programs Report to Congress on Server and Data Center Energy Efficiency Public Law 109-431 Issued August 2, 2007 The following conclusion was stated… … “greater energy-efficiency gains may be realized by optimizing the operation and efficiency of the data center as a holistic system (e.g., through real-time, facility - level energy monitoring and management systems)….” The OSIsoft PI platform is an easy to use infrastructure that allows the collection of data in real-time from any source (IT, BMS, Facilities, networks, etc.) to be retrieved, correlated, analyzed, and visualized to be used to improve energy utilization within the datacenter.
Customers outcomes.. “Your Data Your Decisions” Operating Expense Reduction Capacity Planning Risk Mitigation Deployment Optimization Power Monitoring & Management Green Initiative Carbon Efficiency Contractor Management (SLA) Virtualization success metrics Operations & IT Convergence LEED’s baselining and tracking
Power Distribution Model ALC RDBMS Interface SNMP Interface
Measurement to Value MEASUREMENTS BUSINESS RULES KPI • How are these performing to provised levels? • What is the capacity? To actual? • Slow response times drive down productivity. • Network failure (router or switch) drives transaction Rate to zero. • .CPU per KW used “ Useful work • What is our ability to handle a failure at peak loads? • IT • Network • Device performance • NetFlow • IP SLA • Servers • Applications • Power • PDU • AMP/WATT • UPS Batteries • Float Voltage • Temperature • Smart Power Strips • Mechanical • Chillers • Set points • Efficiencies • CRAC • Humidity • Temperature • Air Handlers • Service hours • Efficiency • Calculations based on actual experience • Indicators • Display real-time and historic
Monitoring with Cisco ISR and PI The new opportunity: • Leverage the reliability and security of the Cisco ISR with integrated PI server to monitor both Operational and IT performance • Improved deployment and integration with a single device • Improved security • Meet compliance requirements • Improved operations • No loss of data • More visibility • Better decision making
OSIsoft/Cisco Architecture PI RtPortal Smart Client • ProcessBook • DataLink • ActiveView Trusted Connections Check in & out documents from SharePoint Internet Explorer RtWebParts • Windows Server 2003 • Windows SharePoint Services • Microsoft SQL Server 2000 Devices/Data sources Thin Client • RtWebParts
Enterprise architecture of PI- Visualization `` ApplicationServers Enterprise PI System ENTERPRISE PortalServers Data Access BusinessSystems Smart Connectors PI Analytics Management & HA AF AF AF AF AF Division Level PI System Division HQ’s PI Analytics AF AF AF Smart Connectors MFG Sites Data Center Remote PI System Remote PI System AF AF PI Analytics Smart Connectors Smart Connectors
Value Now, Value Over Time Value and Effort Target (time, value) Condition Based Maintenance Energy Management Effort Environmental Compliance Heating & Cooling Studies Virtualization BCS Historian Capacity Planning Branch Circuit Monitoring Time { Value with PI Initial Software Investment Incremental effort yields sustainable gains
The ROI Efficiency Increased utilization of DC resources Increased worker productivity- Useful work CPU per KW comparison Condition Based Maintenance (CBM) Operational Intelligence Increased environmental understanding Proactive vs. Reactive Facility Design Improvement
50% 20% 30 to 33%
What does one MW cost for 1 year? • 24 Hours x 365 Days = 8,670 hours in a year • 1 Mega Watt (MW) = 1,000 kilowatts (kW) • At $0.10 per kW Hour gives the simple formula: 8,670 x 1,000 x $0.10 = $876,000 The Cost of 1 MW of power at $0.10 per kWH for one year equals $876,000. • At $0.063 per kW Hour gives the simple formula: 8,670 x 1,000 x $0.063 = $546,210 The Cost of 1 MW of power at $0.063 per kWH for one year equals $546,210.
Very Simplified Math • If DC has 1MW capacity (facilities and IT) • If rate $.063 per kWh (national average) • Total yearly electric cost is $546,200 • Yearly cost reaching the IT (30%) is $165,546 • Potential savings per 1 MW??? • Today represents a typical efficiency of 3 using the proposed PUE metric • Goal is too reach PUE of 2 within 3 years • If no IT improvements the savings would be >$200K per 1 MW of DC
What is the impact of efficiency on the energy cost of an asset at different efficiency levels? • 1 MW for 1 Year @ $0.10 = $876,000 energy bill
Microsoft on OSIsoft as a vendor “We are using the OSIsoft PI System to monitor all the critical points within our data centers, and in turn are laying the foundation for a high-availability, global Live infrastructure...” “The return on investment is tremendous. We are enabling innovation through increased collaboration, social networking and commerce—leading to breakthroughs in software plus services. We are setting industry standards with increased utilization of facility resources, real time business continuity, and green computing technologies. As we continue to expand our Live services, the combination of OSIsoft and Microsofttechnologies are bringing new levels of performance and reliability to our world-class data centers.”
Outcomes by Customers using PI in the data center and facilities • 2 % return of power savings for their global Data Center- Microsoft Data Center Operations • Reduced FTE’s by eliminating manual entry of data enabling real-time reporting - IBM RESO group • Visibility within IT, Facilities, and Public Works for one version of the truth has reduced down-time through rapid troubleshooting and diagnosis- US Army, Ft Carson • An 8% reduction in IT server energy consumption while maintaining a high service level- Weill Medical College of Cornell University • PI became an essential tool to help us take the right decision and contributes to achieve our goal of a reduction of 2% in energy usage annually-Cascades Paper • The overall impact of the system is that Eastman Kodak was able, “with confidence,” to shut down one of the two power plants, leading to savings in the millions of dollars and payback in 24 months.-Eastman Kodak Company
Thank you • Questions? Motterson@osisoft.com Christian@osisoft.com