Download
1 / 23
230 likes | 670 Views
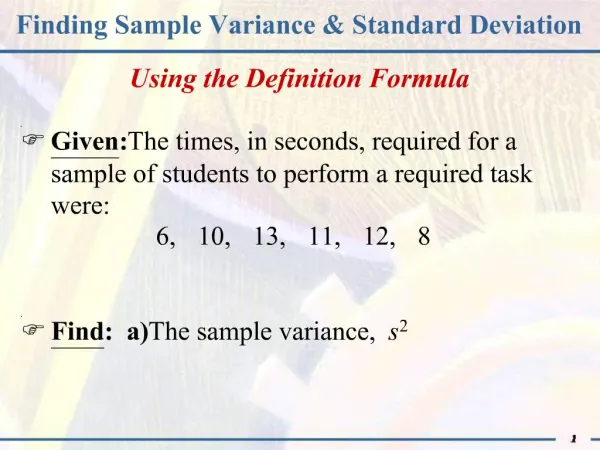
Comparing Two Population Means. ~ Comparing Two Population Means ~. Experimental setup Standard deviation of difference of means Large sample procedures. 1. 1. Experimental Setup Random samples are taken from two populations. The samples are taken independently of one another.

E N D
Comparing Two Population Means ~ Comparing Two Population Means ~ • Experimental setup • Standard deviation of difference of means • Large sample procedures 1 3
1. Experimental Setup • Random samples are taken from two populations. • The samples are taken independently of one another. • We wish to test the equality of two population means. • Samples will be assumed to be large enough so that the Central Limit Theorem applies (n > 30 is large enough in many cases). 2 3
2. Picture of Experimental Setup Population A mean mA s.d. sA Population B mean mB s.d sB sample mean sample s.d sA sample size nA sample mean sample s.d sB sample size nB 3 3 3
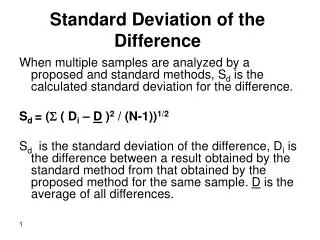
3. Standard Deviation of Difference of Means • The formula for standard deviation is • If the population standard deviations are not know, substitute the sample standard deviations. 4 3
5. Testing Equality of Population Means • The hypotheses of interest are: • H0: population means are equal (mA = mB) • Ha: mA does not equal mB(two-sided) • Ha: mA > mB (upper tail) • Ha: mA < mB (lower tail) 7 3
6. Test Statistic for Testing Equality of Means • The general form of the test statistic is • In this case it is 8 3
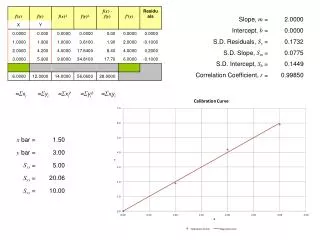
Example. The following summary is the hourly rates of plumbers and electricians, we will test whether the mean hourly rates for plumbers and electricians are the same using α=0.05. Summary: mean s.d. n plumbers: 45.10 3.25 40 electricians: 39.50 4.70 60 The difference of mean is $5.60. The standard deviation of the difference is sqrt[(3.25)2/40 + (4.70)2/60] = .795 The test statistic is z = 5.60/.795 = 7.04 Since 7.04 > 1.96 we conclude that the population means are different. 9 3
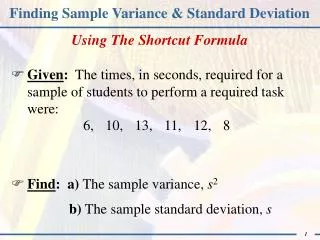
~Two-Sample T-Test ~ • Pooled standard deviation • Test statistic • Assumptions 1 3
Assumptions • Samples are selected randomly from two populations. • The populations have a normal distribution • The standard deviations of the populations are the same. • We wish to test whether or not the means of the populations are the same. • Although test may apply for all sample sizes, it is especially appropriate for small sample sizes. 2 3
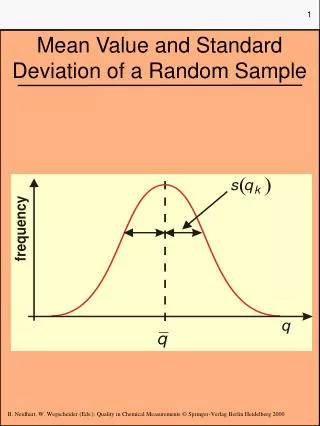
2. Picture of Distributions Population distributions have the same standard deviation, same bell shape mA mB Test to see if there is a difference between population means 3 3
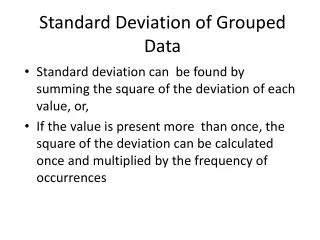
Pooled Standard Deviation • Since the population standard deviations are the same we may pool the data from the two samples to estimate the standard deviation of the population. • The d.f. for sample A = nA - 1 and d.f. for sample B = nB -1, so we have variances weighted by the their d.f’s. 4 3
Test Statistic • The test statistic is a t-statistic • The reference distribution is the t-distribution with nA + nB - 2 d.f. 6 3
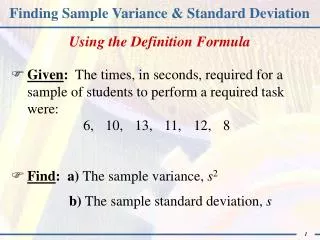
Example: Two plastics produced by different methods were tested for strength. Samples of 5 of plastic A and 4 of plastic B were obtained. Data (1000 lbs/square inch) are given below. A: 5.5 6.8 6.9 5.1 6.0 mean = 6.06 s.d. = 0.79 B: 6.8 7.3 8.0 8.5 mean = 7.65 s.d. = 0.75 pooled s.d. = sqrt[ [4(0.79)2 + 3(.75)2]/7 ]= .77 t = (6.06 - 7.65)/(.77 sqrt[1/5 + 1/4]) = -3.08 (continued) 6 3
Example (continued). The critical 2-sided t-value with 7 d.f. and level of significance .05 is 2.365. Since -3.08 < -2.365, the mean strengths of A and B are declared to be different. 7 3
A Test for the equality of Two Variances • The assumptions for testing the equality of two variances are: • The populations from which the samples were obtained must be normally distributed. • The samples must be independent of each other. 3
Formula • To test Recall that The F test has two terms for the degrees of freedoms: that of the numerator, r1=n-1, and that of the denominator, r2=m-1, where n is the sample size from which the larger variance was obtained. 3
Notes for the Use of the F test • The larger variance should always be • designated as and be placed in the • numerator of the formula. • For a two-tailed test, the α value must be divided by 2 and the critical value be placed on the right side of the F curve. 3
Test of hypotheses of the quality of 2 vars.Hypothesis Critical Region 3
EXAMPLE • A medical researcher wishes to see whether the variance of the heart rates (in beats per minute) of smokers is different from the variance of heart rates of people who do not smoke. Two samples are selected, and the data are as shown. Using α = 0.05, is there enough evidence to support the claim? • Smokers Nonsmokers • n = 9 m = 27 • = 37 = 12 3
State the hypotheses and identify the claim. • Find the critical value. Use the 0.025 table, since α= 0.05 and this is a two-tailed test. Here, d.f.n. = 9 - 1 = 8, and d.f.m. = 27 - 1 = 26. 3
The critical value is 2.73. Compute the test value. • F = • = 37/12 = 3.08 • Make the decision. Reject the null hypothesis, since 3.08 > 2.73. Summarize the results. There is enough evidence to support the claim that the variance of the heart rates of smokers and nonsmokers are different. 3
Remark • When the distributions are normal but the Variances seem to be not equal ie • The t-statistics should be avoided particularly if n and m are also different. In this case use z-test by substituting the sample variances for the population variances. In the latter situation, if n and m are large no problem • When n and m are small use t-test with [r] dfs. 3
Use t-test with small n and m . Variances are not equal • An equivalent formula for r is 3