Meteorological Normalisation of PM10 Trends in Switzerland using Random Forest Models
160 likes | 176 Views
This study presents a meteorological normalisation technique using random forest (RF) models to analyze PM10 trends in Switzerland. The technique utilizes daily PM10 observations and surface meteorological data, and is available in the open source normalweatherrR package. The RF models performed well, with R2 values ranging from 54% to 71%. The study also explores the relative contribution of input variables and explains the variability in PM10 concentrations. The findings highlight the importance of controlling for meteorology in air quality trend analysis.

Meteorological Normalisation of PM10 Trends in Switzerland using Random Forest Models
E N D
Presentation Transcript
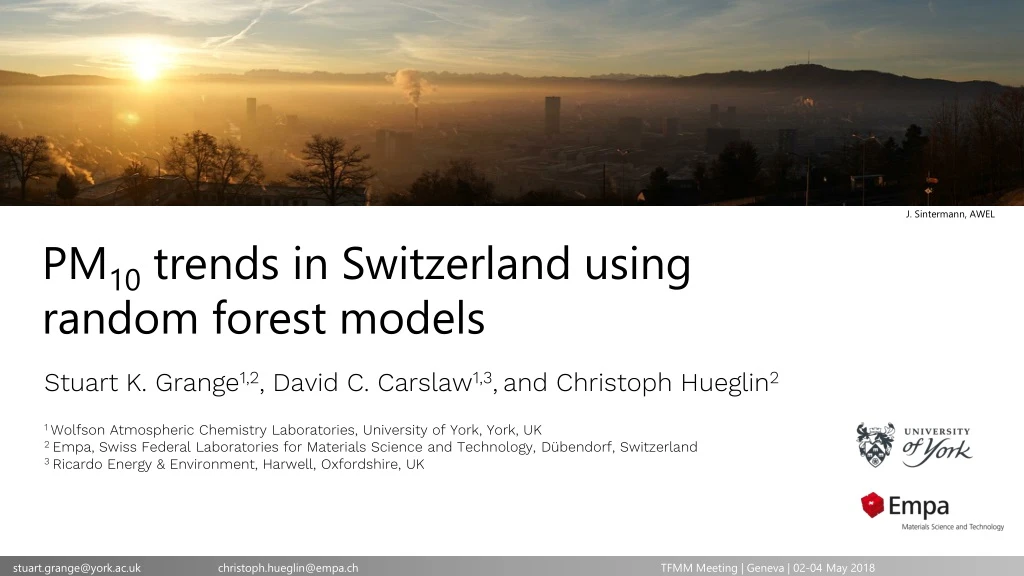
J. Sintermann, AWEL PM10 trends in Switzerland using random forest models Stuart K. Grange1,2, David C. Carslaw1,3,andChristophHueglin2 1 Wolfson Atmospheric Chemistry Laboratories, University of York, York, UK 2 Empa, Swiss Federal Laboratories for Materials Science and Technology, Dübendorf, Switzerland 3 Ricardo Energy & Environment, Harwell, Oxfordshire, UK
Introduction • Trend analysis of ambient air quality data is a common and important procedure • Air quality trend analysis is complicated because trend can be masked or even driven by changes in meteorology • Controlling for meteorology can be an important component of air quality trend analysis • Various methods have been used for meteorology adjustment/normalisation of air quality observations
Objectives • Present a meteorological normalisation technique which uses random forest (RF) to prepare air quality time series for robust trend analysis • Demonstrate the technique using daily PM10 observations across Switzerland between 1997 and 2016 • Details described in Grange et al.ACP (2018) https://www.atmos-chem-phys.net/18/6223/2018/ • Functionality is available in the open source normalweatherrR package (https://github.com/skgrange/normalweatherr)
PM10 – observationsfrom 31 sites MapoftheSwiss PM10 and meteorological monitoringsitesincluded in theanalysis
Data • Daily PM10observationsweresourcedfromsmonitor* Europe, a databasecontainingdatafromthe European AirBaseandairqualitye-Reporting (AQER) repositories • Surface meteorologicaldataincluding wind speed, wind direction, andtemperatureweresourcedfromthe Integrated Surface Database (ISD) at NOAA https://www.ncdc.noaa.gov/isd • Synopticscalecirculationpatternswereincludedintothemodelsbyusingthe CAP9 Swiss Weather Type Classifications (WTC) • Modelled boundary layer heights were derived from the ERA-Interim data • Clustered HYSPLIT back trajectories were used to represent six distinct air masses • * Grange, S. K., smonitorhttps://github.com/skgrange/smonitor
Modelling • RF models using PM10 as the dependent variable for the 31 Swiss monitoring sites were grown • Theexplanatoryvariables were: wind speed, wind direction, temperature, synoptic weather pattern, boundary layer height, air mass cluster, a trend term, a seasonal term, day of the week. • Tuning of RF’s hyper parameters was conducted n=300 80% 20% Conceptualdiagramof a randomforestmodel
Meteorologicalnormalisation • The models were used to predict every observed PM10concentration 1000 times (each site separately) • For every prediction, all the explanatory variables, except the trend term were randomly sampled and allocated to a PM10 concentration • All predictions were then aggregated by the mean and this represented “average” meteorological conditions • The Theil-Sen estimator was used to calculate trends
Model evaluation • The RF models performed well for most PM10 monitoring sites • R2 values ranged from 54 to 71 % • There was no clear pattern between performance and site type
Model evaluation • Importance measures determined the relative contribution of input variables on the prediction of PM10 concentration • Generally, wind speed was the most important variable Importance measures for the 31 RF models. Dots represent the mean and lines represent the interquartile range
Trend analysis • Suburban sites decreased at the smallest rates which maybe because these sites are moving to a “more urban” classification • Urban sitesdemonstrated the greatest negative trend magnitudes • Similartowhat has been reported in the past (Barmpadimos et al, ACP, 2011) Meteorologically normalised PM10 trends aggregated by site type
Explainingthevariability • RF’s learning processes can be interpreted • Partial dependence plots demonstrate how the explanatory variables are being used for prediction
Explainingthevariability • The seasonal component and air temperature partial dependencies were very similar and decision tree methods can handle such collinearity • Very local air masses as well as air mass sourced from Poland and Southern Germany were the most polluted • Boundary layer height: minimum PM10 concentrations when BLH ≈ 1000 metres high but increase again when the BL is over 2000 meters • Weekdays were more polluted than weekends • PM10concentrations were inversely related to wind speed with a non-linear relationship Partial dependence plots for the Zürich-Stampfenbachstrasse RF model
Dependencies on BLH suggestspresenceottworegimes conditions which favour convective mixing, transportation, and generation of secondary aerosol e.g. sulphate A poor dispersive environment during wintertime
Dependencies on BLH suggestspresenceottworegimes Payerne: Rural (lowaltitude)
Conclusions • Controlling for meteorology can be an important component of air quality trend analysis • We presented a meteorological normalisation technique which uses predictive RF models • The technique was tested with daily PM10 observations across Switzerland between 1997 and 2016 • Significantly decreasing trends ranged from -0.09 to -1.16 µg m-3 year-1 • The RF models allow determination of physical and chemical processes influencing ambient PM10 concentrations • - Two regimes resulting in elevated PM10 concentrations were suggested • For a full discussion see Grange et al.ACP (2018) • Functionalitiy available in the normalweatherr R package
Thankyou ! References smonitor. https://github.com/skgrange/smonitor. normalweatherr. https://github.com/skgrange/normalweatherr. Grange, S. K., et al. (2018). https://www.atmos-chem-phys.net/18/6223/2018/ Acknowledgements S.K.G thanks Anthony Wild with the provision of the Wild Fund Scholarship.