Download

1 / 16
160 likes | 260 Views
In South Africa, the energy demand surpasses the existing power capacity. Addressing non-technical losses (NTLs) is crucial for unlocking this capacity. NTLs, which encompass issues like energy theft and administrative inefficiencies, lead to significant financial burdens. Implementing effective demand reduction strategies can generate additional revenue, decrease energy consumption, and reduce the demand peak without major investments. Successful case studies from Brazil illustrate the substantial benefits of reducing NTLs, making this an imperative focus for sustainability and economic competitiveness.

E N D
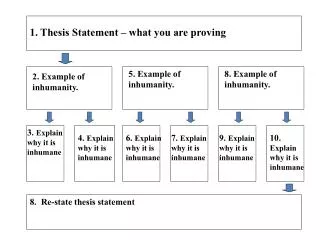
NTLs and the Supply ChallengeProving the Yelland Thesis William C. ErasmusCEM (FSAIEE)
Introduction • In South Africa we have adequate energy (kWhs) but we do not have the power capacity (MW or GW) to meet the demand for energy • This status unequivocally creates an opportunity to unlock power capacity by reducing energy demand through DR and reducing NTLs thereby deferring new investment into generation, transmission and distribution
What are Non-Technical Losses – NTL’s ? Administrative Receivables Commercial • Fraud may be: • Energy theft (illegal connections to the network) • Meter fraud or by-passes • Meter errors • Fraud may be implemented by the customer or by professionals
NTL’s : Commercial Receivables Administrative • High cost of managing aging accounts • Default Customers – Delayed Payments and no payment • Defaulter consumer (*) some will delay, some will not pay • Volume and aging of receivable accounts has HIGH CO$T IMPACT consumer used energy but did not pay on time, which increase company’s financial expenses * Usually not accounted as NTL.
NTL’s : Administrative Commercial Receivables • Internal process flaws and database inconsistencies (Average 20% of all problems identified by C&I Audits in SA) • Human and system errors (*) • Incorrect tariff (*) • Internal fraud (*) * Usually not accounted.
Energy Consumption Reduction Non-Technical Loss Revenue Increase NTLs and the Supply Challenge Energy Cost-free DSM Energy consumption 68%* 32%* Energy paid NTL detection Time * Figures from recent studies in Brazil
Advantages of NTL Reduction • NTLs decrease double benefit • Significant energy consumption reduction - unlocked significant additional power capacity • Revenue increase • Energy consumption reduction • Diminishes total supply • Reduces the demand-peak • Therefore, reducing NTLs has a huge benefit in demand management without additional investments • Cost-free DSM benefits
Brazilian Case Studies Northeast Brasil Area: 1.789 Km2 Consumers : 131 thousand NTLs: 4% SAELPA Area: 54.595 Km2 Consumers : 837 thousand NTLs : 9% Brazil Area: 17.419 Km2 Consumers : 436 thousand NTLs: 4% Southeast Brasil Area: 17.331 Km2 Consumers : 378 thousand NTLs: 2% Date: April / 04
Energisa (SAELPA) • Energisa implemented solutions to reduce NTLs from Feb-03 to Nov-04 at their following distribution companies: • ENERGIPE – Feb/04 • SAELPA/CELB – May/04 • CFLCL/ CENF – Nov/04 • RESULTS AFTER 1-Year • SAELPA has 850 thousand customers in one of poorest states of Brazil • Productivity increase = 90.25% • Energy consumption reduction = 40 GWh • Additional net revenue in 1 year = US$ 2,9 million
Cemar • CEMAR implemented a solution in 2006 and results for 2007 are: • Cemar has 1,35 million customers • Productivity increase = 118.89% • Energy consumption reduction = 227 GWh • Additional net revenue in 1 year = US$ 16,9 million
Energy Energy Consumption Energy Consumption Reduction Non-Technical Loss Revenue Increase Energy Paid NTL Detection Time Measurement of Productivity • ProdGES = { [ in= 1( jm= 1 EbcAiCj + EiAiCj ) ] + EcrGES } • _________________________________________________ • [ in= 1 ( jm= 1CostAiCj ) ]
Opportunity Cost/Benefit Differentiator • Cost to implement a solution to identify sources of NTLs for, say, Jhb Metro (1.4 million consumers) = 20 million USD and deliver result in 1-year with a ROI in excess of 400% • New thermal plant of equivalent unlocked capacity would cost in the region of between 10 to 20 billion USD and take nearly 9-years to complete • The opportunity for the economy is a no-brainer
The Important ? • Business/Economy needs to ask Government/Eskom why the economy is been held to ransom a situation which is critically effecting employment, job creation and the countries ability to remain globally competitive
Optimization Problem • There are several activities to reduce NTLs such as inspections, anti-theft cable-box-seal, AMR, “SMART” meters etc. • Activities can’t be applied to all customers because of economic restrictions hence, distribution companies only have budget for a portion of consumer base • The consequential questions are: • What is the most-effective (ROI) activity for each customer ? • Who are the top customers to apply each activity ? • As a result we are confronted with an optimization problem