Repeat-measures Designs
Repeat-measures Designs. Definition In repeat-measures designs each subject is measured before and one or several times after an intervention. Examples: In Studies of pharmacokinetics of drugs subjects may be measured three hourly for one or more days.

Repeat-measures Designs
E N D
Presentation Transcript
Repeat-measures Designs • Definition In repeat-measures designs each subject is measured before and one or several times after an intervention. • Examples: In Studies of pharmacokinetics of drugs subjects may be measured three hourly for one or more days. In evaluating treatments for the relief of asthma FEV1 may be measured before and after intervention.
Advantages Each subject serves as own control so that the variability between subjects gets isolated. Analysis can focus more precisely on treatment effects. Repeat-measure designs are more economical since each subject is own control and so fewer subjects are needed. Disadvantages Carry-over effect occurs when a treatment is administered before the effects of previous treatment has worn off. Avoided by allowing sufficient time between treatments. Latent effect occurs when a treatment can activate the dormant effects of a previous treatment. Learning effect occurs in situations where response improves each time a person takes a test. Advantages and Disadvantages of Repeat-measures Designs
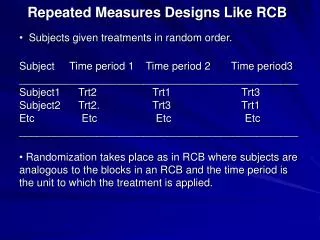
Terminology • Crossover Factor. When an intervention has more than one level and a subject gets measured on each of these levels the intervention factor is called a crossover factor. Crossover factors are time dependent. • Nest Factor. When subjects are in two groups and each group is measured on just one level of the treatment the intervention factor is called a nest factor. Nest factors are time independent. • If research interest is focused on individual subjects the subject factor is fixed. If subjects have been drawn from a larger population that is the focus of interest the subject factor is random.
Principles of Analysis - 1 • Repeated-measures analysis is a generalization of paired ‘t’ test. The only difference is that measurements are made on the same individuals. These are likely to be correlated, and analysis must take such correlations into account.
Principles of Analysis • The variability between subjects is partitioned into between subjects / within subjects. Next the within subjects variability is partitioned into explained by treatment / residual (unexplained) variability.
Assumptions in Repeated-measures Designs • Normality – Each set of data has a Normal distribution. • Random Selection – Selection of subjects has been random from the population of interest. • Homogeneity of variance – Different sets of measurements have homogeneous variances. • Sphericity – Differences in measurements between any two variables are similar to differences between any other two.
Analysis of Co-variance (ANCOVA) Continuous variables that are not part of the intervention but have an influence on the outcome variable are called covariates. In ANOVA we assess significance by comparing total variability against variability explained by the intervention. In ANCOVA we try to explain part of the “unexplained” variability in terms of covariates.
Principles of Analysis - 2 Total Variation Within Subject variation Between Subject Variation Between Treatment variation Residual Variation
Example of Repeat-measures analysis A lecturer assesses teaching by means of pre-test and post–test. The participants comprise a mixed group of residents and research fellows. Analysis of the data is demonstrated in the slides that follow.
Mean Scores Pre and Post In general, the scores have improved for both groups. For Group 1 from mean score of 45 to 57 and for Group 2 from mean score of 43 to 59.
Correlation between pre-test and post-test There is strong correlation between pre and post tests at 0.77
Analysis of Covariance - 1 Analysis using Pre-test as covariate Source DF Seq SS Adj SS Adj MS F P PRETEST 1 802.83 894.91 894.91 44.73 0.000 GROUP 1 166.82 166.82 166.82 8.34 0.010 Error 18 360.16 360.16 20.01 Total 20 1329.81 Total sum of squares is 1329.81. Error term (unexplained) sum of squares is 360.16p value for Group is significant at 0.01
Analysis of Covariance - 2 Source DF Seq SS Adj SS Adj MS F P GROUP 1 74.73 74.73 74.73 1.13 0.301 Error 19 1255.08 1255.08 66.06 Total 20 1329.81 Analysis not using Pre-test as covariate Total sum of squares is 1329.81. Error (unexplained) sum of squares is now 1255.08. But P value for Group is not significant