Download
1 / 24
240 likes | 257 Views
This report outlines strategies and plans to improve patient flow and reduce wait times in healthcare settings. It includes key outcomes, actions taken, and future plans for enhancing services and optimizing patient care.

E N D
Vision: Healthy people, families and communities. VP Quarterly Report on Strategies Q3 – 2015/16 Acting VP: Dawn Calder Integrated Health Services – Clinical Support Multi-year Plan: ED Waits and Patient Flow
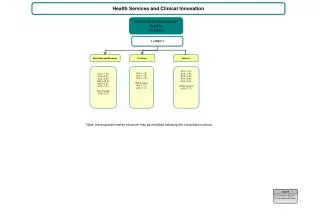
Portfolio Overview • Patient Flow • Pharmacy & Respiratory Services • Medical Imaging • Lab Services • Rehabilitation, Spiritual Care & Native Health Services • HealthLine • Support Services, Central Scheduling & Sterile Processing
Multi Year Strategic PlanVP leading on: • Corporate Patient Flow Multi-year Plan: • Provincial Targets/Priorities - Hoshin ED Waits & Patient Flow • RQHR Multi Year Strategic Plan & Business Plan – Patient Flow • Patient Flow Program / Framework
Patient Flow Multi-year Plan 2015/16 Provincial Outcome & Improvement Targets for Patient Flow • By March 31, 2017, no patient will wait for care in the emergency department. • By March 31, 2016, the length of stay (LOS) in the ER for 90% of admitted patients will be <= 22.3 hours • By March 31, 2016, 90% of patients waiting for an inpatient bed will wait <= 17.5 hours. • By March 31, 2016, the LOS in the ER for 90% non-admitted patients will be <= 5.9 hours
RQHR– ED LOS All Patients Result of Collective Work
RQHR – ED LOS Admitted Opportunity to understand root cause of increase when overall LOS and Time Waiting for an Inpatient Bed and ED admission volumes have decreased 2014/15 vs 2015/16 ( YTD)
RQHR– ED LOS Non-Admitted Result of Collective Work
Root Cause Analysis – Common Themes Service Line/Area Driver Diagram • Appropriateness • Patient Waiting for Service • Bed, Consult, Tests/Diagnostics, etc.. • Staff waiting for information • Results, Orders, etc.
Root Cause Analysis – Common Themes Service Line/Area Driver Diagram • Service Levels Not In-line with Demand • Monday to Friday Business to meet a 24/7 demand. • Variation and lack of Standard Work/Process
Root Cause - Demand and Capacity * FY2015 to FY2016(Projected). Source SCM
Root Cause - Demand and Capacity * Complete FY2015 to 2016 Q1&Q2 only Source HIMS
Key Outcomes-Q3 Our Collective Work is Making a Difference
Key Outcomes-Q3 Reduced Overall ED LOS by 20 min. despite 2.63% increase in ED volumes 2014/15 vs.2015/16 (YTD) 13 min Decrease Time Waiting for an Inpatient Bed 2014/15 vs 2015/16 ( YTD)
Key Outcomes-Q3 Proactive Seasonal Planning
Key Outcomes-Q3 Accountable Care Unit – January 2016 Pilot Kick Off “This is the way healthcare should be” 4A Patient “ We can already see how this model will improve patient care and our overall work day ” 4A Hospitalists “ For the first time I feel I have contributed to and understand the plan of care for my patient” 4A RN
Key Outcomes – Q3 Unit Coaching of Inpatient Flow Standard Work 60%Improvement patients pulled from ED by 14:00 - Planned Vs Actual 100% of inpatient units showed improvement in the application of Patient Flow SW
Key Actions - Q4 Alignment to Activities to Multi-year Hoshin Targets Integrated Timeline Outcome Targets Service Line/Area Driver Diagrams Provincial and Regional Targets & Outcomes
Key Actions Q4 Debrief: Seasonal and Capacity Planning:
Key Actions Q4 ACU Pilot Implementation • Pilot Kick off Jan 15th – Covenant • Research • Localization of Physicians to 4A • ACU Patient Care Processes • Monthly Communication
Key Actions – Q4 Unit Coaching of Inpatient Flow Standard Work 25% of IP units at PH and RGH achieve observed compliance with of all 6 pieces of patient flow SW by March 31, 2016