Download
1 / 17
170 likes | 196 Views
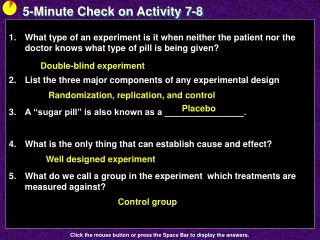
Activity 7 - 8. What’s the Cause?. Objectives. Understand the purpose and principles of experimental design Know when a causal relationship can be established Understand the importance of randomization, control treatments and blinding. Vocabulary.

E N D
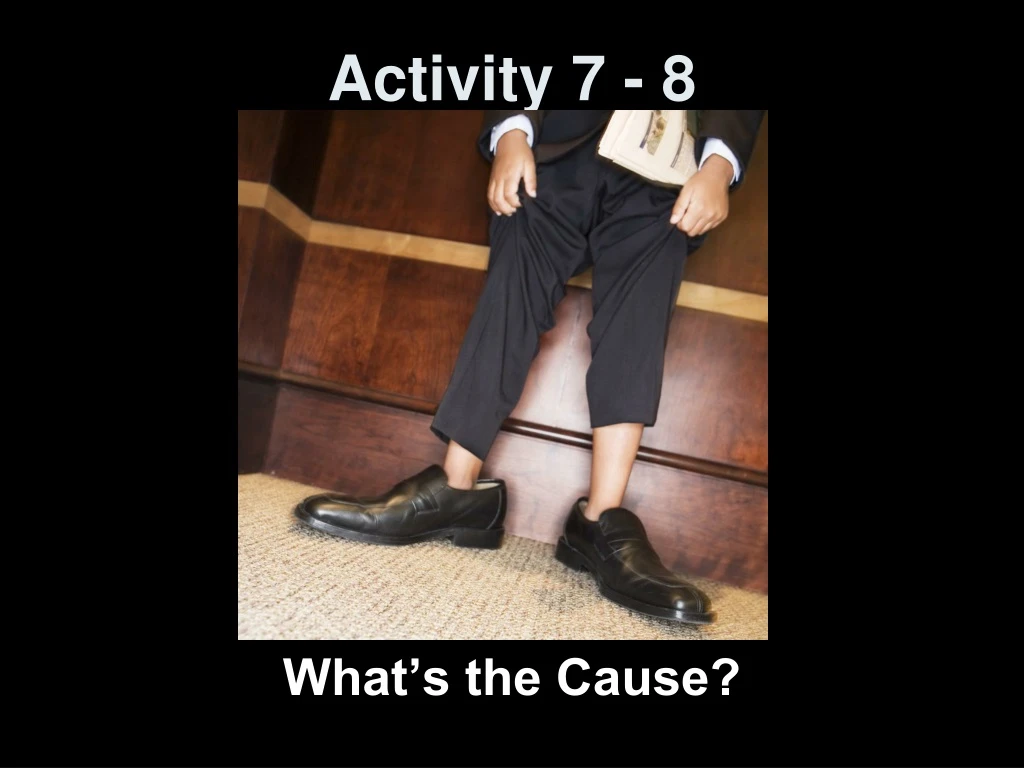
Activity 7 - 8 What’s the Cause?
Objectives • Understand the purpose and principles of experimental design • Know when a causal relationship can be established • Understand the importance of randomization, control treatments and blinding
Vocabulary • Experimental unit – an individual upon which an experiment is performed; (subject is term used for human beings) • Control Group – a group that does not receive a real treatment • Treatment – a specific experimental condition applied to the experimental units • Statistically significant – a term applied to an observed effect so large that it would rarely occur by chance • Double-blind – neither the subjects nor the observers know which treatments any of the subjects had received in an experiment • Design of Experiments – DOE, a course unto itself • Placebo – a treatment that has no effect • Placebo Effect – the ability of the human mind to respond positively to perceived medicine or attention • Replication – the number of units receiving the same treatment
Activity In an early activity, we learned to recognize a linear relationship between two variables. Recall that finding a correlation does not necessarily establish a cause-and-effect relationship between two variables. Suppose a survey of elementary school students in our county results in the following scatterplot of reading level versus shoe size. Reading Level Shoe Size
Activity cont How would you describe the association between reading level and shoe size? Based upon your response above, would you be willing to conclude that an increase in shoe size causes a higher reading level? Why or why not? If your answer was no, can you think of a lurking variable (one not mentioned) that might explain the correlation? generally a positive relationship; larger shoe better reading level age! As people grow their shoe size increases and so does their reading levels
Designed Experiments • Applies treatments to individuals • Attempts to isolate effects of treatment on a response variable • Can determine cause and effect relationships
Basic Parts of Experiments • Experimental units – individuals on which experiment is done • Subjects – experiment units that are human beings • Treatment – specific experimental condition applied to units • Factors – the explanatory variables in the experiment • Level – the combination of specific values of each of the factors
Design of Experiments • Control • Overall effort to minimize variability in the way the experimental units are obtained and treated • Attempts to eliminate the confounding effects of extraneous variables (those not being measured or controlled in the experiment, aka lurking variables) • Randomization • Rules used to assign the experimental units to the treatments • Uses impersonal chance to assign experimental units to treatments • Increases chances that there are no systematic differences between treatment groups • Replication • Use enough subjects to reduce chance variation • Increases the sensitivity of the experiment to differences between treatments
Experimental Variability Any experiment is likely to involve three kinds of variability: • Planned, systematic variability. This is the kind we want since it includes the differences due to the treatments. • Chance-like variability. This is the kind our probability models allow us to live with. We can estimate the size of this variability if we plan our experiment correctly. • Unplanned, systematic variability. This kind threatens disaster! We deal with this variability in two ways, by randomization and by blocking. Randomization turns unplanned, systematic variation into planned, chance-like variation, while blocking turns unplanned, systematic variation into planned, systematic variation. The management of these three sources of variation is the essence of experimental design. Taken from In Introduction to the Design and Analysis of Experiments, George Cobb (1998)
Placebo and Placebo Effect Placebos in medical experiments are often sugar pills. In general they are a treatment that has no effect and is used on control groups to monitor the effect the treatment has within the experiment. The human mind has a remarkable ability to “heal” or react to special attention. This effect is called the placebo effect and must be taken into account when doing an experiment.
Statistical “Blindness” In some studies we don’t want the person giving or getting the treatment to influence the results of the experiment. • To avoid the effects of subject behavior • Subjects not given any medication are often given a placebo such as a sugar tablet • The subjects will not know which treatment they get • To avoid the effects of administrator behavior • The administrators are not told which drug they are administering • When both the subjects and the researchers do not know which treatment, this is called double-blind
Steps in Experimental Design • Identify the problem to be solved • Determine the Factors that Affect the Response Variable • Determine the Number of Experimental Units • Time • Money • Determine the Level of Each Factor • Control – fix level at one predetermined value • Manipulation – set them at predetermined levels • Randomization – tries to control the effects of factors whose levels cannot be controlled • Replication – tries to control the effects of factors inherent to the experimental unit • Conduct the Experiment • Test the claim (inferential statistics)
Example 1 Draw a picture detailing the following experiment: A statistics class wants to know the effect of a certain fertilizer on tomato plants. They get 60 plants of the same type. They will have two levels of treatments, 2 and 4 teaspoons of fertilizer. Someone suggests that they should use a control group. The picture should include enough detail for someone unfamiliar with the problem to understand the problem and be able to duplicate the experiment.
Example 1 cont Random Assignment of plants to treatments:Lay plants out in a line. Draw out of a bag one colored chip (20 chips each of three colors). All plants of the same color assigned to one group below. Experimental Units: tomato plants Group 1 (red) receives 20 plants Group 2 (blue) receives 20 plants Group 3 (white) receives 20 plants Explanatory Variable: amount of fertilizer Treatment ANo Fertilizer Treatment B2 teaspoons Treatment C4 teaspoons Control Group Compare Yieldtotal ounces Response Variable: total ounces produced
Example 2 A baby-food producer claims that her product is superior to that of her leading competitor, in that babies gain weight faster with her product. As an experiment, 30 healthy babies are randomly selected. For two months, 15 are fed her product and 15 are feed the competitor’s product. Each baby’s weight gain (in ounces) was recorded. A) How will subjects be assigned to treatments? B) What is the response variable? C) What is the explanatory variable? No details given. Poor description of random selection Two random selections taking place: getting the 30 and then assigning them to the two products Baby’s weight gain in ounces Baby food brands
Example 3 Two toothpastes are being studied for effectiveness in reducing the number of cavities in children. There are 100 children available for the study. A) How do you assign the subjects? B) What do you measure? C) What baseline data should you know about? D) What factors might confound this experiment? E) What would be the purpose of a randomization in this problem? Randomly divide children into two groups. Pull names out of hat Number of cavities before specific toothpaste and after using Dietary habits, economic status To try and “balance out” the variables that could affect the number of cavities
Summary and Homework • Summary • Experiments are necessary to establish cause-and-effect relationship • Control Group (no treatment applied) • Placebos are given for blinding • Randomization (in selection and for treatments) • Replication (inside experiment and of the experiment) • A double-blind implementation of experiments reduces the amount of changes in behavior • Homework • pg 854-856; problems 1, 3, 4, 6