Download
1 / 86
921 likes | 1.43k Views
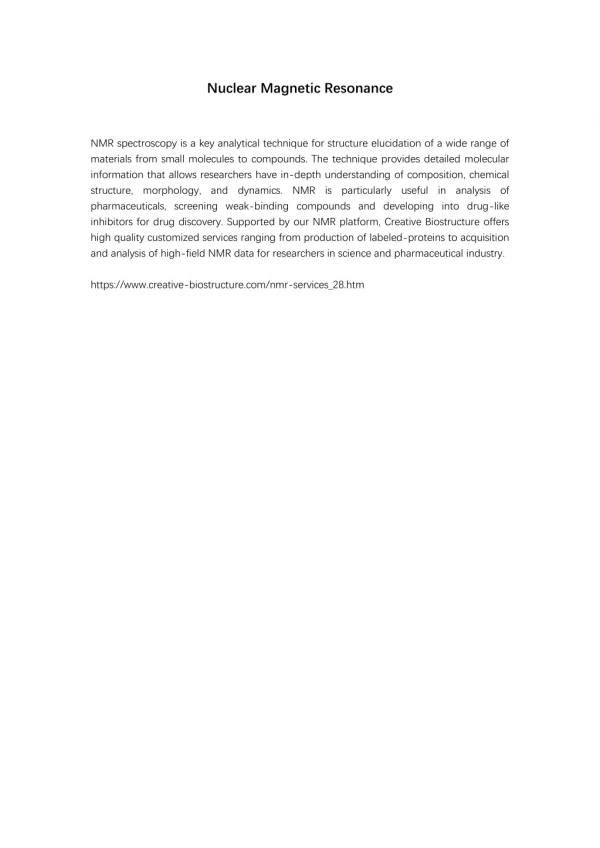
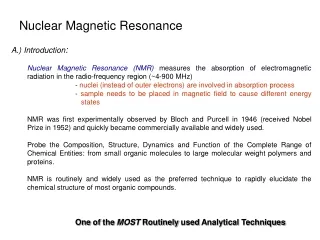
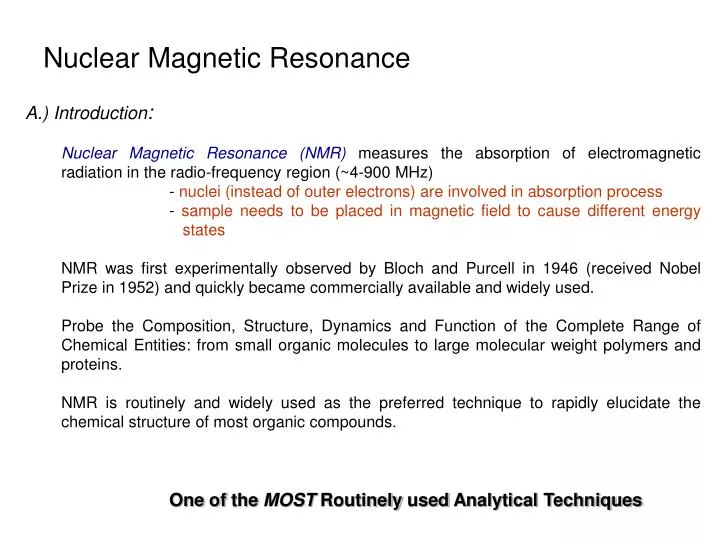
Nuclear Magnetic Resonance. A.) Introduction : Nuclear Magnetic Resonance (NMR) measures the absorption of electromagnetic radiation in the radio-frequency region (~4-900 MHz) - nuclei (instead of outer electrons) are involved in absorption process

E N D
Nuclear Magnetic Resonance A.) Introduction: Nuclear Magnetic Resonance (NMR) measures the absorption of electromagnetic radiation in the radio-frequency region (~4-900 MHz) - nuclei (instead of outer electrons) are involved in absorption process - sample needs to be placed in magnetic field to cause different energy states NMR was first experimentally observed by Bloch and Purcell in 1946 (received Nobel Prize in 1952) and quickly became commercially available and widely used. Probe the Composition, Structure, Dynamics and Function of the Complete Range of Chemical Entities: from small organic molecules to large molecular weight polymers and proteins. NMR is routinely and widely used as the preferred technique to rapidly elucidate the chemical structure of most organic compounds. One of the MOST Routinely used Analytical Techniques
NMR History 1937 Rabi predicts and observes nuclear magnetic resonance1946 Bloch, Purcell first nuclear magnetic resonance of bulk sample 1953 Overhauser NOE (nuclear Overhauser effect) 1966 Ernst, Anderson Fourier transform NMR 1975 Jeener, Ernst 2D NMR 1985 Wüthrich first solution structure of a small protein (BPTI) from NOE derived distance restraints 1987 3D NMR + 13C, 15N isotope labeling of recombinant proteins (resolution) 1990 pulsed field gradients (artifact suppression) 1996/7 new long range structural parameters: - residual dipolar couplings from partial alignment in liquid crystalline media - projection angle restraints from cross-correlated relaxation TROSY (molecular weight > 100 kDa) Nobel prizes 1944 Physics Rabi (Columbia) 1952 Physics Bloch (Stanford), Purcell (Harvard) 1991 Chemistry Ernst (ETH) 2002 Chemistry Wüthrich (ETH) 2003 Medicine Lauterbur (University of Illinois in Urbana ), Mansfield (University of Nottingham)
NMR History First NMR Spectra on Water 1H NMR spectra of water Bloch, F.; Hansen, W. W.; Packard, M. The nuclear induction experiment. Physical Review (1946), 70 474-85.
NMR History First Observation of the Chemical Shift 1H NMR spectra ethanol Modern ethanol spectra Arnold, J.T., S.S. Dharmatti, and M.E. Packard, J. Chem. Phys., 1951. 19: p. 507.
Typical Applications of NMR: • 1.) Structural (chemical) elucidation • ‚ Natural product chemistry • ‚ Synthetic organic chemistry • -analytical tool of choice of synthetic chemists • - used in conjunction with MS and IR • 2.) Study of dynamic processes • ‚ reaction kinetics • ‚ study of equilibrium (chemical or structural) • 3.) Structural (three-dimensional) studies • ‚ Proteins, Protein-ligand complexes • ‚DNA, RNA, Protein/DNA complexes • ‚Polysaccharides • 4.) Drug Design • ‚Structure Activity Relationships by NMR • 5) Medicine -MRI Taxol (natural product) NMR Structure of MMP-13 complexed to a ligand MRI images of the Human Brain
Each NMR Observable Nuclei Yields a Peak in the Spectra “fingerprint” of the structure 2-phenyl-1,3-dioxep-5-ene 1H NMR spectra 13C NMR spectra
Protein Structures from NMR 2D NOESY Spectra at 900 MHz Lysozyme Ribbon Diagram
Some Suggested NMR References “Spin Dynamics – Basics of Nuclear Magnetic Resonance” M. H. Levitt “Tables of Spectral Data for Structure Determination of Organic Compounds” Pretsch, Clerc, Seibl and Simon “Basic One- and Two-Dimensional NMR Spectroscopy” Horst Friebolin “Modern NMR Techniques for Chemistry Research” Andrew E. Derome “NMR and Chemistry- an introduction to modern NMR spectroscopy” J. W. Akitt “Nuclear Magnetic Resonance Spectroscopy” R. K Harris “Protein NMR Spectroscopy: Principals and Practice” John Cavanagh, Arthur Palmer, Nicholas J. Skelton, Wayne Fairbrother “Biomolecular NMR Spectroscopy” J. N. S. Evans “NMR of Proteins and Nucleic Acids” Kurt Wuthrich “Spectrometric Identification of Organic Compounds” Silverstein, Bassler and Morrill
Some NMR Web Sites The Basics of NMR Hypertext based NMR coursehttp://www.cis.rit.edu/htbooks/nmr/nmr-main.htm Integrated Spectral Data Base System for Organic Compounds http://www.aist.go.jp/RIODB/SDBS/menu-e.html Educational NMR Software All kinds of NMR software http://www.york.ac.uk/depts/chem/services/nmr/edusoft.html NMR Knowledge Base A lot of useful NMR links http://www.spectroscopynow.com/ NMR Information Server News, Links, Conferences, Jobs http://www.spincore.com/nmrinfo/ Technical Tidbits Useful source for the art of shimming http://www.acornnmr.com/nmr_topics.htm BMRB (BioMagResBank) Database of NMR resonance assignments http://www.bmrb.wisc.edu/
A Basic Concept in ElectroMagnetic Theory A Direct Application to NMR A perpendicular external magnetic field will induce an electric current in a closed loop An electric current in a closed loop will create a perpendicular magnetic field
g-rays x-rays UV VIS IR m-wave radio 10-10 10-8 10-6 10-4 10-2 100 102 wavelength (cm) Information in a NMR Spectra 1) Energy E = hu h is Planck constant u is NMR resonance frequency ObservableNameQuantitativeInformation Peak position Chemical shifts (d) d(ppm) = uobs –uref/uref (Hz)chemical (electronic) environment of nucleus Peak Splitting Coupling Constant (J) Hz peak separation neighboring nuclei (intensity ratios) (torsion angles) Peak Intensity Integral unitless (ratio) nuclear count (ratio) relative height of integral curve T1 dependent Peak Shape Line width Du = 1/pT2 molecular motion peak half-height chemical exchange uncertainty principal uncertainty in energy
Superconducting Magnet • solenoid wound from superconducting niobium/tin or niobium/titanium wire • kept at liquid helium temperature (4K), outer liquid N2 dewar • 1) near zero resistance minimal current lose magnet stays at • field for years without external power source • c) electric currents in the shim coils create small magnetic fields which compensate inhomogenieties Cross-section of magnet magnet spinner sample lift NMR Tube RF coils cryoshims shimcoils Probe Superconducting solenoid Use up to 190 miles of wire! Liquid N2 Liquid He
Theory of NMR • 1. Quantum Description • Nuclear Spin (think electron spin) • Nucleus rotates about its axis (spin) • Nuclei with spin have angular momentum (p) • 1) quantized, spin quantum number I • 2) 2I+ 1 states: I, I-1, I-2, …, -I • 3) identical energies in absence of external magnetic field • c)NMR “active” Nuclear Spin (I) = ½: • 1H, 13C, 15N, 19F, 31P biological and chemical relevance • Odd atomic mass • I = +½ & -½ • NMR “inactive” Nuclear Spin (I) = 0: • 12C, 16O Even atomic mass & number • Quadrupole Nuclei Nuclear Spin (I) > ½: • 14N, 2H, 10B Even atomic mass & odd number • I = +1, 0 & -1 l
ii. Magnetic Moment (m) • spinning charged nucleus creates a magnetic field • magnetic moment (m) is created along axis of the nuclear spin • m = gp • where: • p – angular momentum • g – gyromagnetic ratio (different value for each type of nucleus) • magnetic moment is quantized (m) • m = I, I-1, I-2, …, -I • for common nuclei of interest: • m = +½ & -½ Magnetic moment Similar to magnetic field created by electric current flowing in a coil
Bo Magnetic alignment = g h / 4p Add a strong external field (Bo). and the nuclear magnetic moment: aligns with (low energy) against (high-energy) In the absence of external field, each nuclei is energetically degenerate
iii. Energy Levels in a Magnetic Field • Zeeman Effect -Magnetic moments are oriented in one of two directions in magnetic field • Difference in energy between the two states is given by: • DE = g h Bo / 2p • where: • Bo – external magnetic field units:Tesla (Kg s-2 A-1) • h – Planck’s constant 6.6260 x 10⁻³⁴ Js • g– gyromagnetic ratio unique value per nucleus • 1H: 26.7519 x 10⁷ rad T-1 s- • Frequency of absorption:n = g Bo / 2p(observed NMR frequency) • From Boltzmann equation: Nj/No = exp(-ghBo/2pkT)
Energy Levels in a Magnetic Field • Transition from the low energy to high energy spin state occurs through an absorption of a photon of radio-frequency (RF) energy RF Frequency of absorption:n = g Bo / 2p
2. Classical Description • Spinning particle precesses around an applied magnetic field • Angular velocity of this motion is given by: • wo = gBo • where the frequency of precession of Larmor frequency is: • n = gBo/2p • Same as quantum mechanical description
z z Mo x x y y b Bo Bo Bo > 0 DE = h n a Bo Net Magnetization • Classic View: • - Nuclei either align with or • against external magnetic • field along the z-axis. • - Since more nuclei align with • field, net magnetization (Mo) • exists parallel to external • magnetic field • Quantum Description: • Nuclei either populate low • energy (a, aligned with field) • or high energy (b, aligned • against field) • - Net population in a energy • level. • - Absorption of radio- • frequency promotes nuclear • spins from a b.
An NMR Experiment We have a net magnetization precessing about Bo at a frequency of wo with a net population difference between aligned and unaligned spins. z z Mo x x y y Bo Bo Now What? Perturbed the spin population or perform spin gymnastics Basic principal of NMR experiments
An NMR Experiment resonant condition: frequency (w1) of B1 matches Larmor frequency (wo) energy is absorbed and population of a and b states are perturbed. z z Mo B1 off… (or off-resonance) x x B1 Mxy w1 y y w1 And/Or: Mo now precesses about B1 (similar to Bo) for as long as the B1 field is applied. Again, keep in mind that individual spins flipped up or down (a single quanta), but Mo can have a continuous variation. Right-hand rule
Classical Description • Observe NMR Signal • Need to perturb system from equilibrium. • B1 field (radio frequency pulse) with gBo/2p frequency • Net magnetization (Mo) now precesses about Boand B1 • MX and MY are non-zero • Mx and MY rotate at Larmor frequency • System absorbs energy with transitions between aligned and unaligned states • Precession about B1stops when B1 is turned off Mz RF pulse B1 field perpendicular to B0 Mxy
z z Mo B1 off… (or off-resonance) x x B1 Mxy w1 y y w1 b DE = h n a Absorption of RF Energy or NMR RF Pulse • Classic View: • - Apply a radio-frequency (RF) • pulse a long the y-axis • - RF pulse viewed as a second • field (B1), that the net • magnetization (Mo) will • precess about with an • angular velocity of w1 • -- precession stops when B1 • turned off • Quantum Description: • - enough RF energy has been • absorbed, such that the • population in a/b are now • equal • - No net magnetization along • the z-axis 90o pulse w1 = gB1 Bo > 0 Please Note: A whole variety of pulse widths are possible, not quantized dealing with bulk magnetization
An NMR Experiment What Happens Next? The B1 field is turned off and Mxy continues to precess about Bo at frequency wo. z x wo Mxy y NMR signal Receiver coil (x) FID – Free Induction Decay Mxy is precessing about z-axis in the x-y plane Time (s) y y y
An NMR Experiment The oscillation of Mxy generates a fluctuating magnetic field which can be used to generate a current in a receiver coil to detect the NMR signal. NMR Probe (antenna) A magnetic field perpendicular to a circular loop will induce a current in the loop.
NMR Signal Detection - FID The FID reflects the change in the magnitude of Mxy as the signal is changing relative to the receiver along the y-axis Detect signal along X RF pulse along Y Again, the signal is precessing about Bo at its Larmor Frequency (wo).
NMR Signal Detection - Fourier Transform So, the NMR signal is collected in the Time - domain But, we prefer the frequency domain. Fourier Transform is a mathematical procedure that transforms time domain data into frequency domain
NMR Signal Detection - Fourier Transform After the NMR Signal is Generated and the B1 Field is Removed, the Net Magnetization Will Relax Back to Equilibrium Aligned Along the Z-axis T2 relaxation Two types of relaxation processes, one in the x,y plane and one along the z-axis
NMR Relaxation • No spontaneous reemission of photons to relax down to ground state • Probability too low cube of the frequency • Two types of NMR relaxation processes • spin-lattice or longitudinal relaxation (T1) • i. transfer of energy to the lattice or solvent material • ii. coupling of nuclei magnetic field with magnetic fields created • by the ensemble of vibrational and rotational motion of the • lattice or solvent. • iii. results in a minimal temperature increase in sample • iv. Relaxation time (T1) exponential decay Mz = M0(1-exp(-t/T1)) Please Note: General practice is to wait 5xT1 for the system to have fully relaxed.
2) spin-spin or transverse relaxation (T2) • i. exchange of energy between excited nucleus and low energy • state nucleus • ii. randomization of spins or magnetic moment in x,y-plane • iii. related to NMR peak line-width • iv. relaxation time (T2) Mx = My = M0 exp(-t/T2) (derived from Heisenberg uncertainty principal) Please Note: Line shape is also affected by the magnetic fields homogeneity
NMR Sensitivity The applied magnetic field causes an energy difference between aligned(a) and unaligned(b) nuclei b Low energy gap Bo > 0 DE = h n a Bo = 0 The population (N) difference can be determined from Boltzmman distribution: Na / Nb = e DE / kT TheDE for 1H at 400 MHz (Bo = 9.5 T) is 3.8 x 10⁻⁵ Kcal / mol Very Small ! ~64 excess spins per million in lower state Na / Nb= 1.000064
NMR Sensitivity • NMR signal depends on: • Number of Nuclei (N) (limited to field homogeneity and filling factor) • Gyromagnetic ratio (in practice g3) • Inversely to temperature (T) • External magnetic field (Bo2/3, in practice, homogeneity) • B12 exciting field strength signal (s) %g4Bo2NB1g(u)/T Na / Nb = e DE / kT DE = g hBo /2p Increase energy gap -> Increase population difference -> Increase NMR signal ≡ ≡ DE g Bo g - Intrinsic property of nucleus can not be changed. (gH/gN)3for 15N is 1000x (gH/gC)3for 13C is 64x 1H is ~ 64x as sensitive as 13C and 1000x as sensitive as 15N ! Consider that the natural abundance of 13C is 1.1% and 15N is 0.37% relative sensitivity increases to ~6,400x and ~2.7x10⁵x !!
NMR Sensitivity • Relative sensitivity of 1H, 13C, 15N and other nuclei NMR spectra depend on • Gyromagnetic ratio (g) • Natural abundance of the isotope g - Intrinsic property of nucleus can not be changed. (gH/gN)3for 15N is 1000x (gH/gC)3for 13C is 64x 1H is ~ 64x as sensitive as 13C and 1000x as sensitive as 15N ! Consider that the natural abundance of 13C is 1.1% and 15N is 0.37% relative sensitivity increases to ~6,400x and ~2.7x10⁵x !! 1H NMR spectra of caffeine 8 scans ~12 secs 13C NMR spectra of caffeine 8 scans ~12 secs 13C NMR spectra of caffeine 10,000 scans ~4.2 hours
NMR Sensitivity Increase in Magnet Strength is a Major Means to Increase Sensitivity
NMR Sensitivity But at a significant cost! ~$2,00,000 ~$4,500,000 ~$800,000
Chemical Shift Up to this point, we have been treating nuclei in general terms. Simply comparing 1H, 13C, 15N etc. If all 1H resonate at 500MHz at a field strength of 11.7T, NMR would not be very interesting The chemical environment for each nuclei results in a unique local magnetic field (Bloc) for each nuclei: Beff = Bo - Bloc --- Beff = Bo( 1 - s ) sis the magnetic shielding of the nucleus
Chemical Shift • Small local magnetic fields (Bloc) are generated by electrons as they circulate nuclei. • Current in a circular coil generates a magnetic field • These local magnetic fields can either oppose or augment the external magnetic field • Typically oppose external magnetic field • Nuclei “see” an effective magnetic field (Beff) smaller then the external field • s – magnetic shielding or screening constant • i. depends on electron density • ii. depends on the structure of the compound Beff = Bo - Bloc --- Beff = Bo( 1 - s ) HO-CH2-CH3 s – reason why observe three distinct NMR peaks instead of one based on strength of B0 n = gBo/2p de-shielding high shielding Shielding – local field opposes Bo
Effect of Magnetic Anisotropy • 1)external field induces a flow (current) of electrons in p system – ring • current effect • 2) ring current induces a local magnetic field with shielding (decreased • chemical shift) and deshielding (increased chemical shifts) Decrease in chemical shifts Increase in chemical shifts
C H 3 H C S i C H 3 3 C H 3 The NMR scale (d, ppm) Bo >> Bloc -- MHz compared to Hz Comparing small changes in the context of a large number is cumbersome w - wref d = ppm (parts per million) wref Instead use a relative scale, and refer all signals (w) in the spectrum to the signal of a particular compound (wref). IMPORTANT: absolute frequency is field dependent (n = g Bo/ 2p) Tetramethyl silane (TMS) is a common reference chemical
The NMR scale (d, ppm) Chemical shift (d) is a relative scale so it is independent of Bo. Same chemical shift at 100 MHz vs. 900 MHz magnet IMPORTANT: absolute frequency is field dependent (n = g Bo/ 2p) At higher magnetic fields an NMR spectra will exhibit the same chemical shifts but with higher resolution because of the higher frequency range.
NMR Spectra Terminology TMS CHCl3 7.27 0 ppm increasing d decreasing d low field high field down field up field high frequency (u) low frequency de-shielding high shielding Paramagnetic diamagnetic 600 MHz 150 MHz 92 MHz 1H 13C 2H Increasing field (Bo) Increasing frequency (u) Increasing g Increasing energy (E, consistent with UV/IR)
Chemical Shift Trends For protons, ~ 15 ppm: For carbon, ~ 220 ppm: Carbon chemical shifts have similar trends, but over a larger sweep-width range (0-200 ppm)
Chemical Shift Trends Alcohols, protons a to ketones Aromatics Amides Acids Aldehydes Olefins Aliphatic ppm 15 10 7 5 2 0 TMS Aromatics, conjugated alkenes C=O in ketones Aliphatic CH3, CH2, CH Olefins ppm 210 150 100 80 50 0 TMS C=O of Acids, aldehydes, esters Carbons adjacent to alcohols, ketones
Common Chemical Shift Ranges Carbon chemical shifts have similar trends, but over a larger sweep-width range (0-200 ppm)
Predicting Chemical Shift Assignments • Numerous Experimental NMR Data has been compiled and general trends identified • See: • “Tables of Spectral Data for Structure Determination of Organic Compounds” Pretsch, Clerc, Seibl and Simon • “Spectrometric Identification of Organic Compounds” • Silverstein, Bassler and Morrill • Spectral Databases: • Aldrich/ACD Library of FT NMR Spectra • Sadtler/Spectroscopy (UV/Vis, IR, MS, GC and NMR) Ongoing effort to predict chemical shifts from first principals (quantum mechanical description of factors contributing to chemical shifts)
Predicting Chemical Shift Assignments Empirical Chemical Shift Trends (Databases) Have Been Incorporated Into A Variety of Software Applications • Example: ChemDraw • Program that allows you to generate a 2D sketch of any compound • can also predict 1H and 13C chemical shifts • matches sub-fragments of structure to structures in database
Predicting Chemical Shift Assignments How Does the Predicted Results Compare to Experimental Data? Parameter Experimental ( ppm) Predicted (ppm) D(A) 6.22 6.44 D(B) 6.53 6.44 D(C) 5.85 5.22 Typical accuracy • A number of factors can affect prediction: • Similarity of structures in reference database • Solvent • Temperature • structure/conformation • additive nature of parts towards the whole
1 H 1 3 C 1 1 H H Coupling Constants Energy level of a nuclei are affected by covalently-bonded neighbors spin-states three-bond one-bond Spin-States of covalently-bonded nuclei want to be aligned. +J/4 J (Hz) bb I S ab ba -J/4 S I I S aa +J/4 The magnitude of the separation is called coupling constant (J) and has units of Hz.
Coupling Constants • through-bond interaction that results in the splitting of a single peak into multiple peaks of various intensities • The spacing in hertz (hz) between the peaks is a constant • i. coupling constant (J) • bonding electrons convey spin states of bonded nuclei • spin states of nuclei are “coupled” • alignment of spin states of bonded nuclei affects energy of the ground (a) and excited states (b) of observed nuclei • Coupling pattern and intensity follows Pascal’s triangle 11 11 2 11 3 3 11 4 6 4 11 5 10 10 5 11 6 15 20 15 6 11 7 21 35 35 21 7 1 Pascal's triangle a b