Download
1 / 21
210 likes | 283 Views
Explore long-term and short-term light curves of 3C 273, analyzing spectral energy distribution and emission components.

E N D
Ten Years of Monitoring 3C 273 with XMM-Newton Liu Liu Advisor: Youhong Zhang Dec. 2, 2010
The Core and the Jet of 3C 273 • 2-10 keV Luminosity: • Black Hole Mass:(Uchiyama et al. 2006)
Spectral Energy Distribution (SED) Kataoka 1999 Optical/UV bump (Soldi et al. 2009)
X-rays: Jet and Seyfert-like component (Grandi & Palumbo 2004) • Jet component: • power-law to MeV region • Seyfert-like component: • power-law, reflection component (Fe line, Compton reflection bump), soft excess
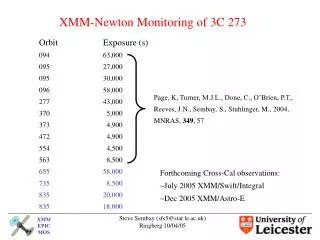
Long-term Light Curves of 3C 273 • Long-term light curves: • soft X-rays, hard X-rays, and the hardness ratios
Short-term Light Curves of 3C 273 MCG-6-30-15 Fabian et al. 2002 • Variability amplitude: • small, different trends from soft to hard X-rays. • The Soft and hard X-rays: • emitted from different radiation process
Fractional rms Variability Amplitudes MCG-6-30-15 Fabian et al. 2002 • E.g. Obs. 7, variation of hard X-ray component: • diluted by a stable soft component in the soft bands.
Hard X-rays: Jet or Seyfert-like?1. power-law fitting Seyfert I galaxies: No positive correlation NGC 5548 NGC 4051 Not Seyfert-like Zdziarski et al. 2003
Hard X-rays: Jet or Seyfert-like? Seyfert I Galaxies: Nandra & Pounds, 1994 Hard X-rays are jet dominated: the iron line emission is overwhelmed by the Doppler boosted jet emission which won’t be reflected by the disk to produce iron lines. MCG-6-30-15 Fabian et al. 2002
Soft X-ray Excess: Inverse Comptonization or Downword Reprocessing? Spectral Energy Density (SED)
Soft X-ray Excess: Inverse Comptonization or Downward Reprocessing? • Jet dominates the hard X-ray emission • reprocessing of the hard X-rays to soft X-rays decrease severely. • No line profile found in RGS spectrum • Soft excess is not dominated by a blend of soft X-ray lines by reprocessing of hard X-rays (Page et al.2004) Model: inverse Comptonization (COMPST in Xspec) UV photons Soft X-rays Key parameter: Fitting results:
Soft X-ray Excess: Inverse Comptonization or Downward Reprocessing?
Optical/UV bump Flux-Frequency Decomposition with R and B Variation amplitude: UV>optical R: stable, dominates optical, (synchrotron) B: variable, dominates UV, (disk emission)
summary • The hard X-rays: the jet component dominates, Seyfert-like component occasionally emerges • Lack of correlation between power-law index and flux • Iron lines are rarely observed and rather weak • The soft X-ray excess: inverse Comptonization of UV photons • Good correlation between soft excess and ultraviolet • Jet dominates the hard X-rays reprocessing to soft X-rays decreases • No line profiles in RGS spectrum • The optical/UV bump: decomposition with a variable UV component and a stable optical component • The X-ray Light curves: different variability trends in the soft and hard X-ray bands
1. Observations by RXTE Long-term light curves Exposure time Observation frequency Energy range/revolution XMM: 30-90 ks, sparse, 0.2-10 keV/high RXTE: 1-2 ks, dense, 2-20 keV/low
1. Observations by RXTE Spectral Index distribtuion No correlation in timescale of month
2. Correlations between parameters Error ellipse
3. Combine the spectral and temporal analysis Light curves Spectral decomposition