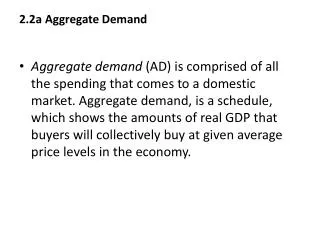
Chapter 11: Aggregate Demand
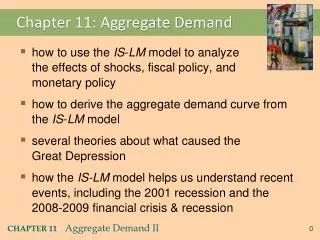
Chapter 11: Aggregate Demand. how to use the IS - LM model to analyze the effects of shocks, fiscal policy, and monetary policy how to derive the aggregate demand curve from the IS - LM model several theories about what caused the Great Depression

Chapter 11: Aggregate Demand
E N D
Presentation Transcript
Chapter 11: Aggregate Demand • how to use the IS-LM model to analyze the effects of shocks, fiscal policy, and monetary policy • how to derive the aggregate demand curve from the IS-LM model • several theories about what caused the Great Depression • how the IS-LM model helps us understand recent events, including the 2001 recession and the 2008-2009 financial crisis & recession
LM r IS Y Equilibrium in the IS-LMmodel The IScurve represents equilibrium in the goods market. r1 The LMcurve represents money market equilibrium. Y1 The intersection determines the unique combination of Y and rthat satisfies equilibrium in both markets.
LM r r1 IS Y1 Y Policy analysis with the IS-LM model We can use the IS-LM model to analyze the effects of • fiscal policy: G and/or T • monetary policy: M
LM r r2 r1 IS2 IS1 Y1 Y2 Y 2. 1. 3. An increase in government purchases 1. IS curve shifts right causing output & income to rise. 2. This raises money demand, causing the interest rate to rise… 3. …which reduces investment, so the final increase in Y
LM r r2 1. 2. r1 1. IS2 IS1 Y1 Y2 Y 2. 2. A tax cut Consumers save (1MPC) of the tax cut, so the initial boost in spending is smaller for T than for an equal G… and the IS curve shifts by …so the effects on rand Y are smaller for T than for an equal G.
LM1 r LM2 r1 r2 IS Y2 Y1 Y Monetary policy: An increase in M 1. M > 0 shifts the LM curve down(or to the right) 2. …causing the interest rate to fall 3. …which increases investment, causing output & income to rise.
Interaction between monetary & fiscal policy • Model: Monetary & fiscal policy variables (M, G, and T) are exogenous. • Real world: Monetary policymakers may adjust Min response to changes in fiscal policy, or vice versa. • Such interaction may alter the impact of the original policy change.
The Fed’s response toG > 0 • Suppose Congress increases G. • Possible Fed responses: 1.hold M constant 2.hold r constant 3.hold Y constant • In each case, the effects of the Gare different…
LM1 r r2 r1 IS2 IS1 Y1 Y2 Y Response 1: Hold M constant If Congress raises G, the IS curve shifts right. If Fed holds M constant, then LM curve doesn’t shift. Results:
LM1 r LM2 IS2 IS1 Y3 Y1 Y2 Y Response 2: Hold r constant If Congress raises G, the IScurve shifts right. To keep r constant, Fed increases Mto shift LM curve right. r2 r1 Results:
LM2 LM1 r r3 r1 IS2 IS1 Y1 Y2 Y Response 3: Hold Y constant If Congress raises G, the IScurve shifts right. To keep Y constant, Fed reduces Mto shift LM curve left. r2 Results:
Estimates of fiscal policy multipliers from the DRI macroeconometric model Estimated value of Y/G Estimated value of Y/T Assumption about monetary policy Fed holds money supply constant 0.60 0.26 Fed holds nominal interest rate constant 1.93 1.19
Shocks in the IS-LM model IS shocks: exogenous changes in the demand for goods & services. Examples: • stock market boom or crash change in households’ wealth C • change in business or consumer confidence or expectations I and/or C
Shocks in the IS-LM model LM shocks: exogenous changes in the demand for money. Examples: • an increase in identity theft increases the demand for money • money demand falls as more people manage their financial accounts online
NOW YOU TRY:Analyze shocks with the IS-LM Model Use the IS-LM model to analyze the effects of 1.a housing market crash that reduces consumers’ wealth 2.consumers using cash more frequently in transactions in response to an increase in identity theft For each shock, a. use the IS-LM diagram to determine the effects on Y and r. b. figure out what happens to C, I, and the unemployment rate.