
포트폴리오와 시장수익률 비교표
포트폴리오와 시장수익률 비교표. 독일 주요 경기 지수 반등. 120 110 100 90 80. ( 지수 ). ( 지수 ). 독일 IFO 기업환경지수 ( 좌측 ). 80 60 40 20 0 (20) (40) (60) (80). 독일 ZEW 경기체감지수 ( 우측 ). 2008 2009 2010 2011 2012. 독일 고용시장 회복. ( 전년대비 ,%). (%). 13 12 11
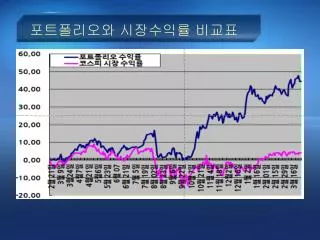

포트폴리오와 시장수익률 비교표
E N D
Presentation Transcript
독일 주요 경기 지수 반등 120 110 100 90 80 (지수) (지수) 독일 IFO 기업환경지수 (좌측) 80 60 40 20 0 (20) (40) (60) (80) 독일 ZEW 경기체감지수 (우측) 2008 2009 2010 2011 2012
독일 고용시장 회복 (전년대비,%) (%) 13 12 11 10 9 8 7 6 6 4 2 0 (2) (4) (6) (8) 독일 분기별 GDP 독일 실업률 (우측) 2000 2003 2006 2009 2012
독일 고용시장 회복 (전년대비,%) (%) 13 12 11 10 9 8 7 6 6 4 2 0 (2) (4) (6) (8) 독일 분기별 GDP 독일 실업률 (우측) 2000 2003 2006 2009 2012
독일 고용시장 회복 (전년대비,%) (%) 13 12 11 10 9 8 7 6 6 4 2 0 (2) (4) (6) (8) 독일 분기별 GDP 독일 실업률 (우측) 2000 2003 2006 2009 2012