Download
1 / 14
140 likes | 157 Views
This workshop explores the complex behavior of stomata, the pores responsible for water and gas exchange in a leaf. It presents a model for understanding the control of stomatal conductance and discusses recent studies on patchy stomatal conductance.

E N D
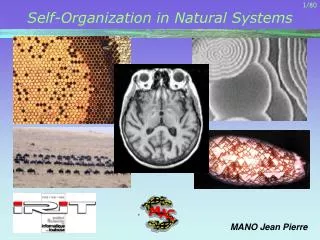
Workshop onTRANSPORT AND SELF-ORGANIZATION IN COMPLEX SYSTEMS • A model for the closure of stomata in a leaf • Carmen P. C. Prado (IFUSP) • Marcus Cima Ferraz (IFUSP, student) • Gustavo Maia Souza (UNOESTE, SP) TSOCS’2004 Porto Alegre, Brasil, agosto 2004
Stomata are pores responsible for water and gas exchange in a leaf CO2 H2O What is a stomata?
Cells turgid – stomata open Cells flacid – stomata close How do estomata control gas exchange (water loss)?
Stomatal patchiness Recent studies have shown that the distribution of stomatal apertures over a leaf surface is not always homogeneous, and under some circumstances show complex spatial patterns known as “patchy stomatal conductance” , indicating a nontrivial collective behavior. Fluorescence images of a leaf for which gas exchange measurements are being taken. Brighter areas = high stomatal conductance. There are oscillations. This movie was created by time lapse photography of chlorophyll fluorescence. Total elapsed time was approximately 5 hours. Patchiness was initiated by a decrease in ambient humidity (Vicia faba).
Guard cells surrounding epidermal tissue Stomatal Unit (SU) Flow among epidermis Flow between guard and epidermis Epidermis of zebrina, light microscope view (X 150). The stomatal pore, guard cells and adjacent cells are visible veins leaf areola Scanning electron micrograph of the epidermis of a cactus J. W. Haefner et al, Plant, Cell and Environment 20, (1997)
Hypothesis of the model (a) water moves among water compartments the leaf in response to water potential gradients; (b) Water flows from the xylem to an evaporating site, that experiences a reduction of water potential proportional to the transpiration rate; (c) Stomatal aperture is a linear combination of epidermal and guard cell turgor pressures; (d) The evaporating sites are in close hydraulic contact with the epidermis; (e) The osmotic pressure of the guard cell is a function of the water potential (turgor) of evaporating site, so stomata will respond to w (water deficit)
For each SU we define: Model equations e epidermis water potential g guard cell water potential e epidermis osmotic pressure g guard cell osmotic pressure g = e e = constant
For each SU i if positive if positive otherwise otherwise Pe,g Turgor pressure Ce,g Mechanical influence coefficients Same equation for Pe; g,e osmotic pressure Water potential e • Changes edepend on (a) in / out water flux and (b) loss by transpiration g I conductance, ~ stomatal aperture Ai W mole fraction difference between leaf interior and ambient air
where Osmotic pressure g To calculate the osmotic pressure, we use hypothesis (e):turgor pressure of epidermis controls (by metabolic means) the osmotic pressure of the guard cell. A high turgor pressure in the epidermic cells causes the solute to be pumped into the guard cell and vice-versa. So, Pe defines the stationary sate of g: The osmotic pressure of the guard cell, then, approximates its stationary state with a velocity that is proportional to gss - g .
For each stomata unit i A “leaf” is defined by the way SU are put toghether and get in touch with veins (boundary conditions) patchiness Summarizing … Ei Ai, Ai Pg - i Pe (if > 0), Pe,g e - e,g(if > 0),
Areola model random vein model Periodic BC Our leaf e of veins = 0 (constant) In this model Areolas are isolated Final patchiness is result of initial disorder and of i distribution
% veins = 20; c= 0.08; = 0.1 Mean stomatal conductance w w Data for a leaf of Xantium strumarium, Plant, Cell and Env., 20 (1997) Results and Conclusions gs
Regime 1: oscillations Leaves