CS232 roadmap
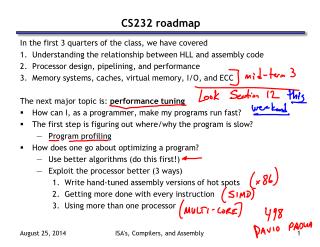
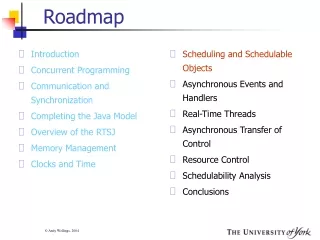
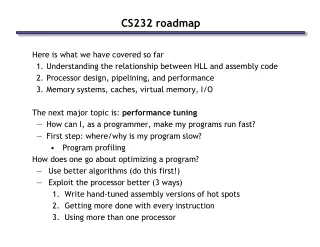
CS232 roadmap. Here is what we have covered so far Understanding the relationship between HLL and assembly code Processor design, pipelining, and performance Memory systems, caches, virtual memory, I/O The next major topic is: performance tuning

CS232 roadmap
E N D
Presentation Transcript
CS232 roadmap Here is what we have covered so far Understanding the relationship between HLL and assembly code Processor design, pipelining, and performance Memory systems, caches, virtual memory, I/O The next major topic is: performance tuning How can I, as a programmer, make my programs run fast? First step: where/why is my program slow? Program profiling How does one go about optimizing a program? Use better algorithms (do this first!) Exploit the processor better (3 ways) Write hand-tuned assembly versions of hot spots Getting more done with every instruction Using more than one processor
Performance Optimization Flowchart “We should forget about small efficiencies, say about 97% of the time.” -- Sir Tony Hoare 2
Collecting data The process is called “instrumenting the code” One option is to do this by hand: record entry and exit times for suspected “hot” blocks of code but this is tedious and error prone Fortunately, there are tools to do this instrumenting for us: Gprof: The GNU profiler (compile with the -pg flag) gcc keeps track of source code object code correspondence also links in a profiling signal handler the program requests OS to periodically send it signals signal handler records instruction that was executing (gmon.out) Display results using gprof command Shows how much time is being spent in each function Shows the path of function calls to the hot spot 3
Performance Optimization, cont. How do we fix performance problems?
Exploiting Parallelism • We can exploit parallelism in two ways: • At the instruction level • Single Instruction Multiple Data (SIMD) • Make use of extensions to the ISA • At the core level • Rewrite the code to parallelize operations across many cores • Make use of extensions to the programming language
+ Exploiting Parallelism at the Instruction level (SIMD) • Consider adding together two arrays: void array_add(int A[], int B[], int C[], int length) { int i; for (i = 0 ; i < length ; ++ i) { C[i] = A[i] + B[i]; } } Operating on one element at a time
+ Exploiting Parallelism at the Instruction level (SIMD) • Consider adding together two arrays: void array_add(int A[], int B[], int C[], int length) { int i; for (i = 0 ; i < length ; ++ i) { C[i] = A[i] + B[i]; } } Operating on one element at a time
+ + + + Exploiting Parallelism at the Instruction level (SIMD) • Consider adding together two arrays: void array_add(int A[], int B[], int C[], int length) { int i; for (i = 0 ; i < length ; ++ i) { C[i] = A[i] + B[i]; } } Operate on MULTIPLE elements Single Instruction, Multiple Data (SIMD)
4.0 (32 bits) 4.0 (32 bits) 3.5 (32 bits) -2.0 (32 bits) + -1.5 (32 bits) 2.0 (32 bits) 1.7 (32 bits) 2.3 (32 bits) 2.5 (32 bits) 6.0 (32 bits) 5.2 (32 bits) 0.3 (32 bits) Intel SSE/SSE2 as an example of SIMD • Added new 128 bit registers (XMM0 – XMM7), each can store • 4 single precision FP values (SSE) 4 * 32b • 2 double precision FP values (SSE2) 2 * 64b • 16 byte values (SSE2) 16 * 8b • 8 word values (SSE2) 8 * 16b • 4 double word values (SSE2) 4 * 32b • 1 128-bit integer value (SSE2) 1 * 128b
SIMD Extensions More than 70 instructions. Arithmetic Operations supported: Addition, Subtraction, Mult, Division, Square Root, Maximum, Minimum. Can operate on Floating point or Integer data.
Is it always that easy? • No, not always. Let’s look at a little more challenging one: unsigned sum_array(unsigned *array, int length) { int total = 0; for (int i = 0 ; i < length ; ++ i) { total += array[i]; } return total; } • Is there parallelism here? • Yes, we could split the loop across two cores
How much faster? • We’re expecting a speedup of 2 • OK, perhaps a little less because of Amdahl’s Law • overhead for forking and joining multiple threads • But its actually slower!! Why?? • Here’s the mental picture that we have – two processors, shared memory total shared variable in memory
This mental picture is wrong! • We’ve forgotten about caches! • The memory may be shared, but each processor has its own L1 cache • As each processor updates total, it bounces between L1 caches Multiple bouncing slows performance
The code is not only slow, its WRONG! • Since the variable total is shared, we can get a data race • Increment operation: total+= … MIPS equivalent: • A data race occurs when data is accessed and manipulated by multiple processors, and the outcome depends on the sequence or timing of these events. Sequence 1 Sequence 2 Processor 1 Processor 2 Processor 1 Processor 2 lw $t0, totallw $t0, total addi $t0, $t0, $t1lw $t0, total sw $t0, totaladdi $t0, $t0, $t1 lw $t0, totaladdi $t0, $t0, $t1 addi $t0, $t0, $t1sw $t0, total sw $t0, totalsw $t0, total counter increases twice counter increases once !! lw $t0, total addi $t0, $t0, $t1 sw $t0, total
We first need to restructure the code unsigned sum_array2(unsigned *array, int length) { unsigned total, i; unsigned temp[4] = {0, 0, 0, 0}; for (i = 0 ; i < length & ~0x3 ; i += 4) { temp[0] += array[i]; temp[1] += array[i+1]; temp[2] += array[i+2]; temp[3] += array[i+3]; } total = temp[0] + temp[1] + temp[2] + temp[3]; for ( ; i < length ; ++ i) { total += array[i]; } return total; }
Then we can write SIMD code for the hot part unsigned sum_array2(unsigned *array, int length) { unsigned total, i; unsigned temp[4] = {0, 0, 0, 0}; for (i = 0 ; i < length & ~0x3 ; i += 4) { temp[0] += array[i]; temp[1] += array[i+1]; temp[2] += array[i+2]; temp[3] += array[i+3]; } total = temp[0] + temp[1] + temp[2] + temp[3]; for ( ; i < length ; ++ i) { total += array[i]; } return total; }
Exploiting a multi-core processor • Hardware can guarantee correctness with atomic operations, but its slow • What if each thread had its own copy of total? (private, not shared) parallel_for (int i = 0; i < length; ++i){ total += array[i]; } parallel_for (int i = 0; i < length; ++i) private(total) { total += array[i]; // increment local copy } // Now reduce the local copies of counter into a single variable • This works because “+” is associative and commutative • fortunately, common operations have these properties
Summary • Performance is of primary concern in some applications • Games, servers, mobile devices, super computers • Many important applications have parallelism • Exploiting it is a good way to speed up programs. • Single Instruction Multiple Data (SIMD) does this at ISA level • Registers hold multiple data items, instruction operate on them • Can achieve factor or 2, 4, 8 speedups on kernels • May require some restructuring of code to expose parallelism • Exploiting core-level parallelism • May require atomic operations to avoid data races • Can sometimes be sped up using reductions