Download
1 / 51
510 likes | 532 Views
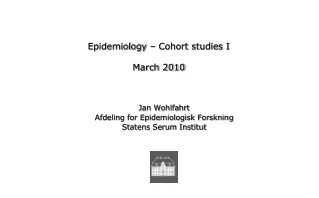
Epidemiology – Cohort studies I March 2010. Jan Wohlfahrt Afdeling for Epidemiologisk Forskning Statens Serum Institut. EPIDEMIOLOGY COHORT STUDIES I March 2009 (modified). Søren Friis Institut for Epidemiologisk Kræftforskning Kræftens Bekæmpelse.

E N D
Epidemiology – Cohort studies IMarch 2010 Jan Wohlfahrt Afdeling for Epidemiologisk Forskning Statens Serum Institut
EPIDEMIOLOGYCOHORT STUDIES IMarch 2009 (modified) Søren Friis Institut for Epidemiologisk Kræftforskning Kræftens Bekæmpelse
”While the individual man is an insoluble puzzle, in the aggregate he becomes a mathematical certainty. You can, for example, never foretell what any one man will do, but you can say with precision what an average number will be up to” • Arthur Conan Doyle • Sherlock Holmes: The Sign of four
Ideal study of a causal effect ”The experience of exposed people is compared with their experience when not exposed, while everything else is held constant” Kenneth Rothman, Modern Epidemiology, 1998
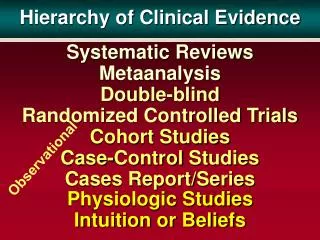
Analyticepidemiological studies Assignment of exposure Yes No Non-experimental studies Non-experimental studies Experimental studies Sampling according to exposure status Sampling according to outcome status Random allocation no yes Randomised/ intervention trials Community intervention trials Case-control studies Cohort studies
Cohort studiesClassical definition • ”The delineation of a group of persons who are distinguished in some specific way from the majority of the population and observation of them for long enough to allow any unusual morbidity or mortality to be recognised” • Richard Doll 1964
Cohort studiesRecent definition • Experiments • Randomised clinical trials • two (or multiple)-arm, cross-over • Field trials • intervention on single-person level • Community intervention trials • intervention on community level • Non-experimental cohort studies
Udfald + Exposed Censored Population at risk - + Non-exposed Censored - Past Present Future Identify study subjects and assess exposure characteristics Follow-up
Population at risk • Individuals at risk of developing the outcome(s) of interest • Basis for computation of measures of diseases frequency and effect measures • Classified according to exposure characteristics • At baseline • During follow-up • Censoring at • First outcome (typically) • Death • Migration • Upper age limit, if age restriction • Other criteria, e.g. exposure shift
Cohort • ”Any designated group of individuals who are followed or traced over a period of time” • Kenneth Rothman, Modern Epidemiology, 1998 • Can be divided into closed and open populations
Closed and Open Populations • Closed population • A population that adds no new members over time • Open/dynamic population • A population that may gain members over time or lose members who are still alive • e.g. drug users within a specific observation period
Closed populationlimitations • Loss to follow-up (censoring) • Decreasing cohort size • Aging of cohort members • Depletion of susceptibles
Selection of the exposed population • General population • Diet, Cancer & Health cohort, Danish Cancer Society • Individuals aged 50 to 64 years, follow-up from 1994 (n 57,000) • Occupational exposure groups • Nurses Health Study, USA • Nurses aged 30 to 55 years, follow-up from 1976 (n 120,000) • Exposure • ”Special exposure groups” • Ex.: Workers at the Thule base, Epileptics at Dianalund, individuals exposed to thorotrast • Drug users • Registers • General Practice Research Database, UK • Danish health and administrative registers
Selection of the comparisongroup • Ideally identical to the exposed group with respect to all other factors that may be related to the disease except the outcome(s) under study • ”Internal” comparison • general population/large occupational cohort • frequent exposure • ”External” comparison • General population (rates) • Standardised incidence rate ratio (SIR) • Standardised mortality rate ratio (SMR)
Exposure Existing data registers medical records bio-banks Questionnaires interview self-administered Ad hoc measurements clinical parametes biological samples Outcome Registers Clinical examination Information from study subjects interview questionnaire Information from next-of-kin Mortality data Data sources
Can examine multiple effects of a single exposure rare exposures Exposures with certainty precede outcomes (if prospective) Allows direct measurement of incidence (IR, IP) of outcomes Can elucidate temporal relationship between exposure and outcome Allow study subjects to contribute person-time to multiple exposure categories Biological material can be collected prior to outcome If prospective, minimizes bias in the ascertainment of exposure Cohort studies Advantages
Is inefficient for the evaluation of rare diseases If prospective, can be very expensive and time consuming If retrospective, requires the availability of adequate records for both exposure and outcome If prospective, cannot provide quick answers If retrospective, precise classification of exposure and outcome may be difficult Validity of the results can be seriously affected by losses to follow-up Cohort studies Disadvantages
Cohort studies Methods for reduction of costs and time • Historical cohort studies • Comparison with general population (rates) • Nested case-control studies • Register studies
Register studies in DK Frank L. Science 2000;287: 2398-9
Register studies in DK Cancer Registry National Death Files CPR Register IDA Register (socioeconomic variables) Birth Register National Hospital Register Prescription Databases
Register studies • Registers are highly valuable data sources, BUT • Difficulties in interpretation due to incomplete data on competing risk factors • Life-style factors, socioeconomic factors, comorbidity, medical treatment • Other potential biases • Misclassification, non-compliance, etc.
Measures of diseasefrequency Definitions What is the case? What is the study period? What is the population at risk?
Measures of diseasefrequency, summary • Incidence proportion (IP) • Proportion of population that develops the outcome of interest during a specified time • Can be measured only in closed populations • ”Average risk” for a population • Incidence rate (IR) • Number of new cases of the outcome of interest divided by the amount of person-time in the base population • Can be measured in both open and closed populations • Most often restricted to include a maximum of one event per person • Prevalence proportion (PP) • Proportion of population that has the outcome of interest at given instant
Effect measures in cohort studies • IP+ = a/a+b • IP- = c/c+d • RR = IP+/IP- • Attributable risk (AR) = IP+ - IP- • Attributable proportion (AP) = AR/IP+ = (RR-1)/RR
Incidence proportion Conditions • All persons should be followed-up from start of study (t0) until end of study with respect to the outcome(s) of interest • Problems: • Open/dynamic population (t0?) • Competing risks of death • Censoring • Is usually not directly observable, solution: • Computation of incidence rates
Relation between rate (IR) og risk (IP) • IP = 1 - exp(-IR x t) (IR constant) • IP = 1 - exp(- IRí x tí ) (IR variable) • IR small and/or short t: • IP IR x t
Time dimension cases Non-exposed Exposed cases Person-time in study Problem: Exposure status changes over time (episodical, sporadical) Solution: Allow persons to contribute person-time to multiple exposure categories
Ex Age 30-year-old man is enrolled in a cohort study of drug X in relation to disease Y in 1970 and followed free of Y through 1995 55 50 Y 45 40 35 35-year-old man is enrolled in 1970 and followed until occurrence of Y in 1983 30 1995 1970 1975 1980 1985 1990 Calendar time X Non-X
Effect measures in cohort studies Cases Person-time cases A PY Exposure Non-exposed Yes Exposed C PY No cases A = Exposed cases C = Non-exposed cases Person-time in study Incidence rate = cases / person-time Incidens Rate Ratio (IRR) = IR+ / IR-
Effect measures in cohort studies • IR+ = a/PY+ • IR- = c/PY- • Incidence rate ratio (IRR) = IR+/IR- • Incidence rate difference = IRD (≈AR) = IR+ - IR- • AP = IRD/IR+ = (IR+-IR-)/IR+ = (IRR-1)/IRR
”Relative risk” vs. incidence rate ratio Given IP IR x t (IR small) ”Relative risk” is equivalent with the ratio of two incidence rates when the disease is rare
Effect measures in cohort studies Indirect Standardisation • Do more outcomes occur in the studied population than would be expected if the risk prevailing was the same as in the general population? • Estimation of expected number of outcomes • Number of person-years at risk x incidence rate • PYage,period,sex x incidenceage,period,sex • Observed number/expected number ≈ RR • Standardised incidence ratio (SIR)
SIR = Observed number of outcomes/ expected number of outcomes = Obs/IRpop x PYexp = (Obs/PYexp) / IRpop = IRexp / IRpop ≈ IRexp / IR0 = IRR (RR) Calendar time
Risk window Exposure Often unknown
Relevant exposure? Ex Ex Ex 1-3 days? Ex Ex Ex 10-15 days? Ex Ex Ex 100-150 days? Ex Ex Ex years?
Hazardfunction Theoretical association Outcome Exposure
Hazardfunctions Outcome Exposure
Ex NSAID cohortstudy • Population: Saskatchewan – province in Canada with appr. 1.1 mill. inhabitants • A study of the association between use of NSAIDs and risk of gastrointestinal (GI) bleeding included all 228,392 individuals who had redeemed one og more prescriptions for NSAIDs. The study subjects were followed during the period 1982-1986 for hospitalization due to upper GI bleeding • From the paper: .. Entered our cohort upon the first receipt of a prescription for diclofenac, indomethacin, naproxen, piroxicam or sulindac. Person-time contributed by this person continued until the earliest of: 1) hospitalization due to UGB, 2) death, 3) departure from Saskatchewan or 4) end of study • Note!: No control group of ’non-exposed’ Garcia Rodriguez et al. NSAIDs and GI-hospitalizations in Saskatchewan: A cohort study. Epidemiology 1992;3:337-42
Ex The person time of the study subjects was categorized according to time since last prescription 1. Rx Current user Recent past user Non-user Old past user # 1 Day0 30 60 150 Current user Current user Current user Current user Recent past user # 2 Day0 30 30 30 30 60 1.Rx 4.Rx 2.Rx 3.Rx
Ex Modified from Garcia Rodriguez et al. NSAIDS and GI-hospitalizations in Saskatchewan: A cohort study. Epidemiology 1992;3:337-42
Absolute vs. relative disease measures • Avoid confusing measures of frequency with measures of association (effect measures) Ex: • A RR=10 is described as a high risk, or a population for whom RR=10 is said to be at higher risk than a population in which RR=5 • A RR=10 may be described as a high relative risk
Ex Risk of deepveinthrombosis (DVT)Third vs. second generation oral contraceptives • RR 1.7 (1.4-1.7) • AR 1.5 per 10 000 person-years • Mortality of DVT 3% • Kemmeren et al. BMJ 2001; 323: 131-4
Ex Vioxx (rofecoxib) and cardiovasculardiseaseAPPROVetrial • 2,586 patients randomised to rofecoxib (Vioxx) (25 mg daily; n=1287) or placebo (n=1299) during a 3-year study period • 1.50 CVE per 100 py (46 events; 3,059 py) vs. • 0.78 CVE per 100 py (26 events; 3,327 py) • RR = 1.92 (1.19-3.11) • AR 72 pr. 10 000 py Bresalier et al. N Engl J Med 2005; 352: 1092-1102
Attributable proportions • What proportion of the disease among the exposed is attributable to the exposure (APexp)? APexp = IR+-IR0 / IR+ = AR / IR+ = (RR-1)/RR • What proportion of the disease in the total study population of exposed and non-exposed individuals is attributable to the exposure (APpop)? APpop = IRpop-IR0 / IRpop = AR x pe / IRpop (pe = exp. prevalence in population) = APexpx pc (pc = exp. prevalence among cases) = [(RR-1) x pe]/ [(RR-1) x pe - 1]
”Non-smoker” ”Smoker” ”Non-drinker” 1 4 ”Drinker” 3 12 Ex Attributable proportionIncidence rates of head and neck cancer per 100,000 py • Among drinking smokers, what proportion of head and neck cancer is caused by smoking? • Among drinking smokers, what proportion of head and neck cancer is caused by drinking?
”Non-smoker” ”Smoker” ”Non-drinker” 1 4 ”Drinker” 3 12 Ex Attributable proportionIncidence rates of head and neck cancer per 100,000 py • Among drinking smokers, what proportion of HNC is caused by smoking? • AP = IRD/IR+S+A = (IR+S+A-IR-S+A)/IR+S+A = (12-3)/12 = 75%
”Non-smoker” ”Smoker” ”Non-drinker” 1 4 ”Drinker” 3 12 Ex Attributable proportionIncidence rates of head and neck cancer per 100,000 py • Among drinking smokers, what proportion of HNC is caused by drinking? • AP = IRD/IR+S+A = (IR+S+A-IR+S-A)/IR+S+A = (12-4)/12 ≈ 67%
Ex A hypothetical population consists of 20.000 users of non-steroidanti-inflammatory drugs (NSAIDs) og 100.000 non-users of NSAID. The studysubjectsarefollowed for oneyear for the occurrence of upper gastrointestinal (GI) bleeding Please calculate the following measures of frequency and risk: 1. Incidence rate (IR) for GI bleeding in each exposure group 2. Incidence rate ratio (IRR) for the association between NSAID and upper GI bleeding 3. Incidence rate difference (IRD≈AR) between NSAID users and non-users 4. Attributable proportion (APexp) among users of NSAIDs 5. Attributable proportion (APpop) in the total population (Censoring in the risk population should be ignored)

![16: Odds Ratios [from case-control studies]](https://cdn0.slideserve.com/464336/16-odds-ratios-from-case-control-studies-dt.jpg)