Stock Valuation for Analysts
170 likes | 196 Views
Dive into common stock valuation methods like Dividend Discount Model & Price Ratio Models. Learn about historical growth rates & two-stage dividend growth model analysis. Explore financial analysis of the McGraw-Hill Company.

Stock Valuation for Analysts
E N D
Presentation Transcript
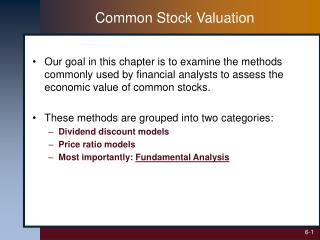
Common Stock Valuation • Our goal in this chapter is to examine the methods commonly used by financial analysts to assess the economic value of common stocks. • These methods are grouped into two categories: • Dividend discount models • Price ratio models • Most importantly: Fundamental Analysis
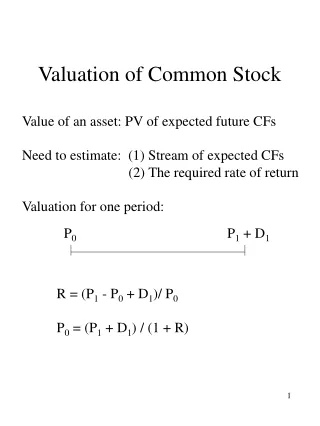
The Dividend Discount Model • In the DDM equation: • V(0) = the present value of all future dividends • D(t) = the dividend to be paid t years from now • k = the appropriate risk-adjusted discount rate
The Dividend Discount Model: the Constant Growth Rate Model • Assume that the dividends will grow at a constant growth rate g. • Then, the dividend next period (t + 1) is: • In this case, the DDM formula becomes:
The Dividend Discount Model:the Constant Perpetual Growth Model. • Assuming that the dividends will growforever at a constant growth rate g. • In this case, the DDM formula becomes:
The Historical Average Growth Rate • Suppose the Kiwi Company paid the following dividends: • 1998: $1.50 2001: $1.80 • 1999: $1.70 2002: $2.00 • 2000: $1.75 2003: $2.20 • The spreadsheet below shows how to estimate historical average growth rates, using arithmetic and geometric averages.
The Sustainable Growth Rate • Return on Equity (ROE) = Net Income / Equity • Payout Ratio = Proportion of earnings paid out as dividends • Retention Ratio = Proportion of earnings retained for investment
The Two-Stage Dividend Growth Model • The two-stage dividend growth model assumes that a firm will initially grow at a rate g1 for T years, and thereafter grow at a rate g2 < k during a perpetual second stage of growth. • The Two-Stage Dividend Growth Model formula is:
An Analysis of theMcGraw-Hill Company The next few slides contain a financial analysis of the McGraw-Hill Company, using data from the Value Line Investment Survey.
The McGraw-Hill Company Analysis, VI. Quick calculations used: P/CF = P/E EPS/CFPS P/S = P/E EPS/SPS
Useful Internet Sites • www.nyssa.org (the New York Society of Security Analysts) • www.aaii.com (the American Association of Individual Investors) • www.aimr.com (the Association for Investment Management and Research) • www.valueline.com(the home of the Value Line Investment Survey) • Websites for the companies analyzed in this chapter: • www.aep.com • www.dteendergy.com • www.americanexpress.com • www.pepsico.com • www.starbucks.com • www.sears.com • www.intel.com • www.disney.go.com • www.mcgraw-hill.com
Chapter Review, I. • Security Analysis: Be Careful Out There • The Dividend Discount Model • Constant Dividend Growth Rate Model • Constant Perpetual Growth • Applications of the Constant Perpetual Growth Model • The Sustainable Growth Rate
Chapter Review, II. • The Two-Stage Dividend Growth Model • Discount Rates for Dividend Discount Models • Observations on Dividend Discount Models • Price Ratio Analysis • Price-Earnings Ratios • Price-Cash Flow Ratios • Price-Sales Ratios • Price-Book Ratios • Applications of Price Ratio Analysis • An Analysis of the McGraw-Hill Company