Download
1 / 17
170 likes | 289 Views
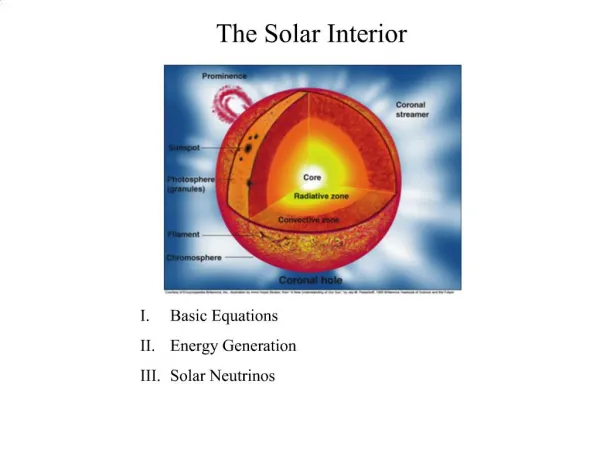
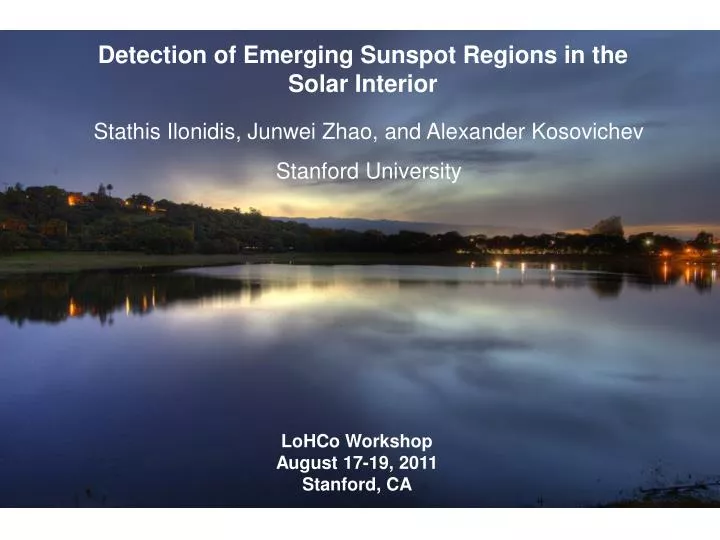
Detection of Emerging Sunspot Regions in the Solar Interior. Stathis Ilonidis, Junwei Zhao, and Alexander Kosovichev Stanford University. LoHCo Workshop August 17-19, 2011 Stanford, CA. Emerging Magnetic Flux. Goals:

E N D
Detection of Emerging Sunspot Regions in the Solar Interior Stathis Ilonidis, Junwei Zhao, and Alexander Kosovichev Stanford University LoHCo Workshop August 17-19, 2011 Stanford, CA
Emerging Magnetic Flux • Goals: • To detect the Emerging Magnetic Flux before the start of magnetic field emergence in the photosphere. • To predict the evolution of an emerging flux region soon after the start of magnetic field emergence in the photosphere. • Scientific Benefit: • Depth of generation of magnetic active regions • Strength of magnetic field deep inside the convection zone • Structure and kinematics of emerging flux in the convection zone • Speed of emerging flux • Formation of sunspots and active regions Practical Benefit: 1. Space weather forecast
Method (part I) • We select an annulus on the surface and we uniformly divide it into 6, 8, 10, 12, and 14 arcs. • The oscillation signal is averaged inside the arc. • Cross-covariances are computed between diametrically opposite arcs (same color).
Method (part II) 4. We use 4 orientations for each of the five arc lengths (20 configurations in total). • All of the cross-covariances are added together to increase the signal-to-noise ratio. • Steps 1 - 5 are repeated for 31 annuli. All of the cross-covariances are added together to further increase the signal-to-noise ratio. • The final cross-covariance is fitted with a Gabor wavelet and the acoustic phase travel time is obtained.
Data • Tracking & Remapping: • Data: MDI/HMI Dopplergrams • Tracking rate: Carrington • Remapping: Postel’s projection • Duration: 8 hours • Size: 256 X 256 pixels • Spatial Resolution: 0.12 degrees/pixel • Temporal Resolution: 1 minute/45 s • Processing: • Frequency filter: 2 – 5 mHz • Phase-speed filter: 92 – 127 km/s
Acoustic Waves Depth Range: 42 – 75 Mm 1-skip Horizontal Distance: 111 – 198 Mm
Results • Travel-time maps of 5 emerging flux regions: • AR NOAA 10488 (MDI) • AR NOAA 8164 (MDI) • AR NOAA 8171 (MDI) • AR NOAA 7978 (MDI) 5. AR NOAA 11158 (HMI) • Travel-time maps of 9 quiet regions Estimate of noise level
Results of AR 10488 03:30 UT 26 Oct 2003 03:30 UT 26 Oct 2003 03:30 UT 27 Oct 2003
Travel-time maps of AR 10488 -11 h -10 h -9 h -8 h -6 h -7 h -5 h -4 h -3 h
Results of AR 8164 00:00 UT 23 Feb 1998 00:00 UT 23 Feb 1998 00:00 UT 24 Feb 1998
Results of AR 7978 11:30 UT 06 Jul 1996 11:30 UT 06 Jul 1996 11:30 UT 07 Jul 1996
Results of AR 8171 04:30 UT 27 Feb 1998 04:30 UT 27 Feb 1998 04:30 UT 28 Feb 1998
Estimates of noise level From 9 quiet regions: 1σ = 3.3seconds
Comparison with Numerical Simulations Thin flux tube simulation of an emerging Ω-shaped tube. The figure shows the time since the onset of the Parker instability as a function of depth of the tube apex. From: Yuhong Fan Living Rev. Solar Phys., 6, (2009), 4 • Emerging time from a depth of 60 Mm until the surface = ~2 days. Consistent with our measurements of AR 7978. • Rising flux tube models of Fan (2008) imply wave travel-time shifts of ~1 s (Birch et al., 2010). Inconsistent with our results (travel-time shifts of ~12-16 s).
Conclusions • Strong emerging flux events cause travel-time shifts of the order of 12-16 s at depths of 42-75 Mm and therefore they can be detected before the magnetic field emergence in the photosphere. It is not known what has caused these travel-time shifts. • The average emergence speed from a depth of ~60 Mm up to the surface is 0.6 and 0.3 km/s for the strongest and weakest analyzed events respectively. The detected anomalies appear at the surface 1-2 days after their detection. Therefore our method may improve space weather forecasts by allowing anticipation of large sunspot regions and predicting the development of an emerging flux region. • The detection of magnetic field at a depth of ~60 Mm possibly poses a low limit to the depth of generation of large magnetic active regions. • The amplitude of the detected travel-time shifts is at least 1 order of magnitude larger than the amplitude of the expected travel-time shifts based on numerical simulation models (with field strength 10^5 G at the bottom of the convection zone). • The detected structures at depths of 42-75 Mm are mostly circular with a typical size of 30-50 Mm. But the accuracy on the location and the shape of these structures is limited by the horizontal wavelength which is ~35 Mm at 3.5 mHz.