Download
1 / 38
380 likes | 811 Views
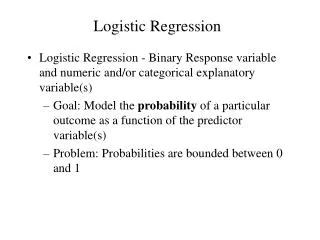
Logistic Regression: Part 2 “Why include covariate adjustment?” Confounding, Mediation and Attenuation Robert Boudreau, PhD Co-Director of Methodology Core PITT-Multidisciplinary Clinical Research Center for Rheumatic and Musculoskeletal Diseases. Confounding. Confounding is :

E N D
Logistic Regression: Part 2 “Why include covariate adjustment?” Confounding, Mediation and Attenuation Robert Boudreau, PhD Co-Director of Methodology Core PITT-Multidisciplinary Clinical Research Center for Rheumatic and Musculoskeletal Diseases
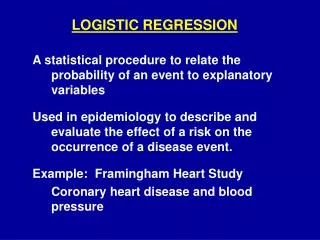
Confounding Confounding is: • a bias in the estimation of the effect of exposure on disease or outcome due to inherent differences in risk between exposed and unexposed groups Exposures: Drug exposure, dose, duration Outcomes: Blood pressure control (< 120/80) Adverse events (fainting, mortality) Risk Factors: Prior MI, BMI, Exercise(or lack of)
Criteria to be a Confounder Confounder: The factor must • be a cause of the disease or outcome, or a surrogate measure of a cause, in unexposed people; factors satisfying this condition are called risk factors • be correlated, positively or negatively, with exposure in the study population. If the study population is classified into exposed and unexposed groups, this means that the factor has a different distribution (prevalence) in the two groups • not be an intermediate step in the causal pathway between the exposure and the disease
Example of Confounder Among people diagnosed with high BP and prescribed antiHTN drug Blood Pressure Control ( <120/80) Take antiHTN Drug Daily (Y,N) Compare Rates of BP Control: Those who take drug daily vs Those who take it less frequently
Example of Confounder Among people diagnosed with high BP and prescribed antiHTN drug Daily Exercise Blood Pressure Control ( <120/80) Take antiHTN Drug Daily (Y,N) Compare Rates of BP Control: Those who take drug daily vs Those who take it less frequently
A “cause” of the outcome even in the unexposed group Regular daily exercise contributes to lower blood pressure Daily Exercise Blood Pressure Control ( <120/80) Take antiHTN Drug Daily (Y,N) Compare Rates of BP Control: Those who take drug daily vs Those who take it less frequently
2. Correlated with Exposure Regular daily exercisers are more likely to take their meds daily Daily Exercise Blood Pressure Control ( <120/80) Take antiHTN Drug Daily (Y,N) Compare Rates of BP Control: Those who take drug daily vs Those who take it less frequently
Confounder Diagram Confounder Outcome Exposure
Example of Mediator • Muscle weakness occurs in ~10% of statin users • In a study evaluating the potential adverse side effects of statin use • on mobility problems (may or may not be the case) • Muscle weakness is in the pathway (= mediator) • Prior muscle weakness before statin use may also be a confounder Statin Drug (to control lipids) Muscle Weakness Mobility Problems
General Interpretation of Covariate Adjustment E.g. Association of CRP levels with KneeOA … adjusted for BMI Interpretation: • Add adjustment for BMI CRP differences (KneeOAvs Not) between individuals with the same BMI • The proverbial “all other things being equal”
White Females: 2-Group Comparison Using Dummy-coded Groups * No OA is “referent” group (KneeOA=0); proc reg data=kneeOA_vs_noOA; model logCRP= KneeOA; where female=1 and white=1; run; “No OA” mean “kneeOA” mean difference from referent Same p-value as equal variance t-test Note: Regression using Dummy (0, 1) for group variable (e.g. KneeOA=0,1) In regression, equal (pooled) variance is assumed
ANCOVA (Analysis of Covariance)Compare logCRP adjusted for BMI proc reg data=kneeOA_vs_noOA; model logCRP=KneeOA BMI; where female=1 and white=1; run; Unadjusted diff (was 0.33) has been attenuated BMI partially “explains” this difference Note: Equal BMI slopes in each group is being modeled
Notice: At any BMI level, the mean logCRP difference between KneeOA vs Not is smaller than the unadjusted difference Unadjusted Mean Difference {
Randomized Controlled Trials • Patients randomized => to different interventions ( e.g. type of drug, or dose, or to placebo group) • Strength: balances risk factors across all groups => equal socio-demographic characteristics => equal health status, health behaviors => equal pre-clinical and clinical disease risk factors Balancing removes “arrow” from factors to “exposure” Eliminates biases in estimates of drug effect(s) due to confounders
Randomized Controlled Trials Weakness/limitations • Inclusion/exclusion criteria often results in study population with fewer complications or comorbidities than individuals living in the community • Sample sizes too small to identify adverse events with low probabilities that can show up when drug goes to market and is used by a large number of people • Rarely are products compared that were developed by different pharmaceutical companies (pending: CER)
Non-Randomized Data Sources • Healthcare Utilization Databases (Medicare Part D, United HealthCare, UPMC, VA) => selected outcomes => socio-demographics, comorbidities => historical health services utilization (inpatient & outpatient) => clinical information from electronic medical records => records of drug use (dose, Rx purchases) over time
Non-Randomized Data Sources • Observational Longitudinal Cohort Studies (e.g. Framingham Heart Study – ongoing since 1948 Health, Aging and Body Composition Study) => Participants have annual (or periodic) clinic visits => BMI, Strength Testing, Bone Density Scans, MRIs => Gait speed, Cognitive tests, Depression scales => Self-reported health (general, sleep probs, anxiety, …) => Drug use, dose, frequency (typically brown bag – “bring all meds you take” ) => Hospitalizations (MI, CHF, Stroke, Fractures …)
Non-Randomized Data SourcesAnalysis Challenges • Wide range of characteristics and measures • Often longitudinal (collected at multiple timepoints) • Confounding is extensive due to being observational • Similar issue in lab studies involving DAS-28 remission, assays, ELISA, ELISPOT, etc. following “physician preference” prescribing of drugs • Must be addressed to obtain valid, unbiased estimates • Proper selection of covariates for adjustment based on clinical and subject matter expert knowledge
Is Physician A Confounder If Treatment Not Randomized ? Physician’s Criteria (unmeasured ?) [1] MTX+Enbrel [2] MTX+Humira DAS drop > 1.2 Compare DAS-28 response: [1] MTX+Enbrel (Th17 cytokines ?) [2] MTX+Humira
Health, Aging and Body Composition (Health ABC) Longitudinal Cohort Study • Observational study of 3075 men and women • age 70-79 • 45% African-American • Pittsburgh, PA and Memphis, TN • Able to walk 1/4 mile and climb 10 steps (study eligibility criteria) • Designed to assess the relationship of weight and body composition to • incident weight related diseases and • Disability • Baseline (Year 1) = 1997; Just completed Year 13 (2010); continuing … • Funded by NIH/NIA (National Institute on Aging) 1997 - • University of Pittsburgh • University of Tennessee, Memphis • Coordinating Center: University of California, San Francisco • Laboratory for Epidemiology, Demography and Biometry, NIA
Health, Aging and Body Composition Longitudinal Cohort Study Central Nervous System Drugs (CNS drugs) • opioid receptor agonist analgesics, antidepressants, antipsychotics, and benzodiazepine receptor agonists Clinical Indications • self-reported sleep problems • anxiety • depression • pain
Health ABC: CNS Drug Ancillary Study Hanlon JT, Boudreau RM, Roumani YF, Newman AB, Ruby CM, Wright RM, Hilmer SN, Shorr RI, Bauer DC, Simonsick EM, Studenski SA. Number and dosage of central nervous system medications on recurrent falls in community elders: the Health, Aging and Body Composition study. J Gerontol A Biol Med Sci 2009;64A(No.4):492-498
Health, Aging and Body Composition Longitudinal Cohort Study Outcome: • Falls in the previous year • Validatedoutcome (numerous studies): 2+ falls can use Logistic Regression for binary outcome
Anxiety is a Confounder HABC Year 2 Anxiety (Y,N) Take CNS drug (Y,N) 2+ Falls (Y,N) Note: Each arrow will be statistically verified in the next 3 slides
CNS drug use is associated withhigher rates of 2+ falls (Bottom arrow) CNS drug use (overall): 14.8% (368/2693) @Yr2 Percent with 2+ falls CNS drug use No 7.3% (169/2325) Yes 13.6% (50/368) P<0.0001 0.136/(1-0.136) Odds-Ratio (OR) = ------------------- = 2.01 0.073/(1-0.073)
Anxiety is associated withhigher rates of 2+ falls(Right diagonal arrow) Percent with 2+ falls Anxiety No 7.2% (130/1811) Yes 10.1% (89/882) P=0.0095 0.101/(1-0.101) OR = ------------------- = 1.45 0.072/(1-0.072)
Anxiety is associated withhigher rates of CNS drug use (Left diagonal arrow) Percent with CNS drug use Anxiety No 10.6% (206/1947) Yes 20.3% (196/964) P<0.0001 OR = 2.16
Anxiety is a Confounder HABC Year 2 Anxiety (Y,N) Take CNS drug (Y,N) 2+ Falls (Y,N)
Gender is not a confounder HABC Year 2 Gender (M, F) Take CNS drug (Y,N) 2+ Falls (Y,N)
Gender is not a confounder Percent with CNS drug use Gender M 11.1% (146/1318) F 16.4% (225/1375) P<0.0001 Percent with 2+ Falls Gender M 8.2% (108/1318) F 8.1% (111/1375) P=0.9082 2nd comparison => Rates of 2+ falls same by gender
Depression is a Confounder HABC Year 2 Depression (Y,N) Take CNS drug (Y,N) 2+ Falls (Y,N)
Smoking is not a confounder,but is associated with falls HABC Year 2 Current Smoker (Y,N) Take CNS drug (Y,N) 2+ Falls (Y,N)
Multivariable Logistic Regression Model 1 (unadjusted) OR C.I. P-value CNS drug use 2.01 (1.43, 2.81) <0.0001 Model 2 CNS drug use 2.02 (1.44, 2.83) < 0.0001 Female 0.94 (0.71, 1.24) 0.6595 (NS) Model 3 CNS drug use 1.90 (1.44, 2.83) 0.0002 Anxiety 1.35 (1.02, 1.80) 0.0383
Anxiety partially “explains” apparent association of CNS drugs & falls Model 1 (unadjusted) OR C.I. P-value CNS drug use 2.01 (1.43, 2.81) <0.0001 Model 3 CNS drug use 1.90 (1.44, 2.83) 0.0002 Anxiety 1.35 (1.02, 1.80) 0.0383 Notice: CNS drug use OR has been “attenuated” => CNS drug OR is smaller adjusted for Anxiety => Additional “odds-ratio” effect on falls (with or without Anxiety) OR=1.90
Covariates Considered in Health ABC CNS Drug Study • SocioDemogs: race gender age site education LivingAlone • HealthBehaviors: CurrentSmoker PastSmoker CurrentDrinker PastDrinker Underweight Overweight Obese • HealthStatus/comorbidities: CHD CHF CVA Diabetes Hypertension Pulmonary PAD SomeLeak FrequentLeak Self-reported Fair/Poor Health Poor_to_CompletelyBlind Hearing Impairment • Indications for CNS: SleepProblems Osteoarthritis MildPain ModeratePainOrWorse Anxiety Depression • Surrogate for disease severity: # of “Other” Rx Drugs
The most strongly associated factors(backwards stepwise regression) Model 1 (unadjusted) OR C.I. P-value CNS drug use 2.01 (1.43, 2.81) <0.0001 Model 4 (fully adjusted) CNS drug use 1.81 (1.28, 2.57) 0.0009 Diabetes 1.56 0.0146 Some Leak 1.43 0.0411 FrequentLeak 1.56 0.0147 Poor-to-completely blind 2.49 0.0046 Anxiety 1.32 0.0186 # other Rx drugs 1.04 0.0308
Health, Aging and Body Composition Longitudinal Cohort Study Outcome 2 or more falls in the previous year “ in the previous 12 months have you fallen and landed on the floor or ground. ” For those answering in the affirmative, they were asked, “ how many times did you fall in the previous 12 months. ” The choices were: 0, 1, 2-3, 4-5, 6 or more Validatedoutcome (numerous studies): 2+ falls
Thank you ! Any Questions? Robert Boudreau, PhD Co-Director of Methodology Core PITT-Multidisciplinary Clinical Research Center for Rheumatic and Musculoskeletal Diseases