Download
1 / 13
130 likes | 298 Views
2013 Youth Satisfaction Survey. October 18, 2013. How survey was administered. Youth trained on evaluation, survey administration, and confidentiality Youth then administered the survey State Youth Coordinator and UNM Faculty Proctored the surveys. Who Took the Survey.

E N D
2013 Youth Satisfaction Survey October 18, 2013
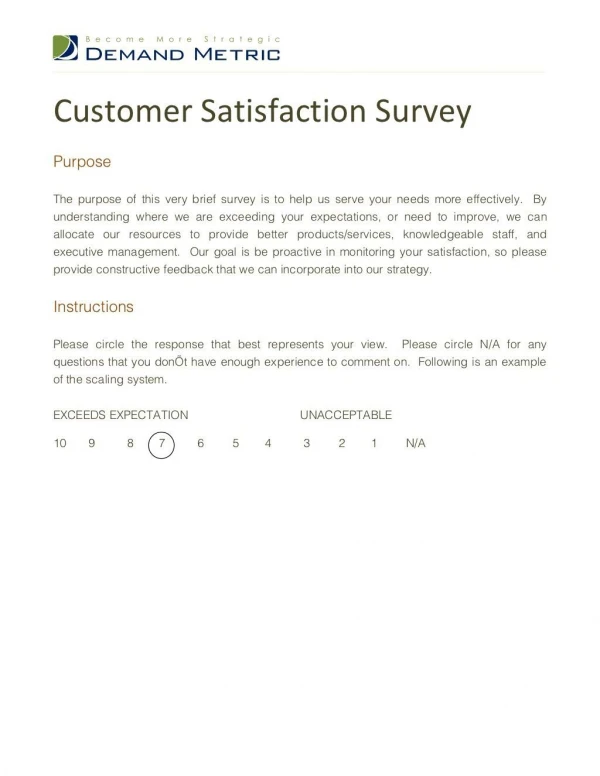
How survey was administered • Youth trained on evaluation, survey administration, and confidentiality • Youth then administered the survey • State Youth Coordinator and UNM Faculty Proctored the surveys
Who Took the Survey • Youth Aged 12-24 years old • Number of youth in the community: • Number of youth in commitment facilities: • Ethnicity: White (28%), Hispanic (50%), Asian (1%), African American (6%), Native American/Alaskan Native (5%), Bi/Multiracial (8%) and Other (2%) • Respondents were both male (n=187) and female (n=68) with 5 respondents not reporting gender
Highlights • Statewide youth were most satisfied with their participation in treatment (89%) and their ability to choose their own treatment goals (83%); the cultural competency of staff (85%); and the way staff communicated in a way that was understandable (85%). • Statewide Youth were least satisfied with their ability to choose services they received (53%) and the location of services (61%). • Youth living in the community vs. youth living in detention facilities were generally more satisfied with the services they received within the past 12 months (either in the community or in facilities) and felt that services in the past 12 months had a positive effect on their lives.
For more information • Dr. Deborah Altschul at daltschul@salud.unm.edu • Erica Padilla at Erica.Padilla@state.nm.us