Download
1 / 15
150 likes | 283 Views
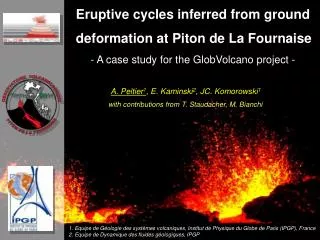
Annual cycles in deformation. Einar Ragnar Sigurðsson. Leveling lines: monitoring of Katla. Eysteinn Tryggvason in two time periods: 1967-1973 1986-1995 Monitoring of underground processes preceding eruption in Katla. Ref. Tryggvason, 1973. Signal from leveling observation.

E N D
Annual cycles in deformation Einar Ragnar Sigurðsson
Leveling lines: monitoring of Katla • Eysteinn Tryggvason in two time periods: • 1967-1973 • 1986-1995 • Monitoring of underground processes preceding eruption in Katla Ref. Tryggvason, 1973
Signal from leveling observation • Amount of yearly tilting 1.4 to 4.5mrad • Direction changing every year Ref. Tryggvason, 1973
Possible causesof annual variations • Atmosphere changes • Soil moisture and groundwater variation • Temperature variations • nontidal ocean loading • Variation in ice and snowload Ref. Tryggvason, 1973 and Geirsson et al, 2006
Simple model for variable snow load • Use of various data • Precipitation data from the nearest weather stations • Increased precipitation with elevation • Temperature profile same as measured at Keflavik • clear correlation • Little or none time delay • Calculated R coefficient for correlation: highest for 0 days delay, R=0.63 • Elastic plate over a liquid substratum modeling gave plate thicknes 6.8 to 8.5km • 99% confident the seasonal leveling is true and not caused by magmatic movements Ref. Tryggvason, 1973 and Tryggvason, 2000
GPS network • First station in year 1995 • Monitoring of crustal movements related to: • Plate spreading • Magmatic movements • Earthquakes • They show annual cycles in deformation as well. Ref. Geirsson et al, 2006
A cosinus model for crustal displacement • The varying position, function of time in years: y(t) • Initial position: a • Linear trend: b*t • Annual factor for cycles in deformation: • Amplitude: A • period: 2pt • phase: Skrokkalda (SKRO) rel. to REYK, uplift mm Year Ref. Geirsson et al, 2006
Elastic half space and Green’s functions For an elastic halfspace after having convolved Green’s functions with the load we have the horizontal and vertical displacement as: at a point ȓ. The variables are r for the density of a load with thickness h integrated over the area R making the load. Poisson ratio is taken to be n = 0.25 and g is the gravity acceleration Ref. Grapenthin et al, 2006
Snow load on each glacier • Constant load over each glacier • Vatnajökull, Mýrdalsjökull, Hofsjökull and Langjökull • Good data of snow (water equivalent) thickness • Raster size for modeling area of glaciers: 50x50m Ref. Grapenthin et al, 2006
The variable snow load the snow load is taken to be of constant thickness over each glacier but varying with time. So the ice load thickness at a point ȓ‘ at time t is: where thm is the phase for maximum ice thickness and hm is the maximum ice thickness and With this equation for h and the other two for displacement used with data for displacement from CGPS stations, the only unknown, free parameter will be the Young modulus E. Ref. Grapenthin et al, 2006
Young modulus E Ref. Grapenthin et al, 2006
The model fit HÖFN-REYK SAUD-REYK SOHO-REYK SKRO-REYK Ref. Grapenthin et al, 2006
Annual displacement cycle according to the model • Maximum vertical displacement in center of Vatnajökull: 37mm • Maximum horizontal displacement on east end of Vatnajökull: 6mm • Note the low horizontal displacement areas on the three smaller glaciers on side to Vatnajökull Ref. Grapenthin et al, 2006
Possible improvements of the model • The uniform thickness of snow load on glaciers • The same melting and accumulating time -> cosinus function is not the best model • Other seasonal causes of deformation Ref. VeðurstofaÍslands, 2013 Ref. Grapenthin et al, 2006
References • Geirsson, H., T. Árnadóttir, C. Völksen, W. Jiang, E. Sturkell, T. Villemin, P. Einarsson, F. Sigmundsson, and R. Stefánsson (2006), Current plate movements across the Mid-Atlantic Ridge determined from 5 years of continuous GPS measurements in Iceland, J. Geophys. Res., 111, B09407, doi:10.1029/2005JB003717. • Grapenthin, R., F. Sigmundsson, H. Geirsson, T. Árnadóttir, and V. Pinel (2006), Icelandic rhythmics: Annual modulation of land elevation and plate spreading by snow load, Geophys. Res. Lett., 33, L24305, doi:10.1029/2006GL028081. • Tryggvason, 1973. Surface Deformation and Crustal Structure in the Mýrdalsjökull Area of South Iceland. Journal of geophysical research, vol 78, No 14, p. 2488 – 2497. • Tryggvason, 2000. Ground deformation of Katla: Result of precision levellings 1967-1995. Jökull No 48, p. 1-8 • VedurstofaÍslands, 2013. http://brunnur.vedur.is/myndir/harmonie/ downloaded 22.04.2013