The Power of Microarray Technology
280 likes | 560 Views
The Power of Microarray Technology. Ruth G. Alscher. Gene Expression: Control Points. Responses to Environmental Signals. Glycolysis, Citric Acid Cycle, and Related Metabolic Processes. Free Radicals Attack Cells: Survival Mechanisms? . ROS Arise as a Result of Exposure to:. Ozone

The Power of Microarray Technology
E N D
Presentation Transcript
The Power of Microarray Technology Ruth G. Alscher
Glycolysis, Citric Acid Cycle, and Related Metabolic Processes
ROS Ariseas a Result of Exposure to: • Ozone • Sulfur dioxide • High light • Paraquat • Extremes of temperature • Salinity • Drought
Free radicals arise throughout the cell when stress is imposed .
Effects of Drought Stress on Gene Expression in Loblolly Pine Trees - Virginia Tech: determining which genes are essential for resistance to stress Plant Biologists: Drs. Alscher and Chevone., Cecilia Vasquez CS: Drs. Heath and Ramakrishnan, Margaret Ellis, Logan Hanks Statistics: Dr Key, Xiao Yang. NC State(Forest Biotechnology): discovering new genes in loblolly pine. Ying-Hsuan Sun, Drs. Sederoff and Whetten:
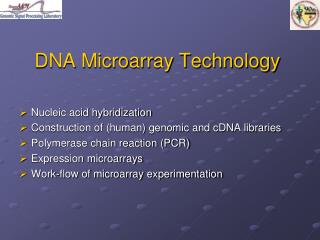
Investigating gene expression patterns in stressed loblolly pine Selected cDNAs are spotted on to a glass surface (can be up to 20,000 different sequences spotted on to one slide). cDNAs derived from mRNA populations obtained from treated or control tree are hybridized to the cDNAs on the slide.
The Expression of Multiple Genes Can be Visualized Simultaneously Using Microarrays
RelativeAbundance Detection Detection Treatment Control 1 2 1 2 1 2 2 3 1 3 3 3 Emission Excitation Mix 1 2 3 1 2 3 Spots: (Sequences affixed to slide) Hybridization
The Expression of Multiple Genes Can be Visualized Simultaneously Using Microarrays
Iterative strategy for detection of genetic interactions using microarrays Detection of gene expression effects on microarrays 1 Genetic Regulatory Networks Test mutant phenotypes Characterize gene function 4 2 3 Identify mutants
Design of Microarrays • Clones on the drought-stress microarrays werereplicated and randomly placed • Experiment involved 384 archived pine ESTs • Organized into 4 microtitre source plates after PCR • Pipetted into 8 sets of 4 microtitre plates each • Each set a different random arrangement of 384 ESTs • Printed type A microarrays from first 4 sets • Printed type B microarrays from second 4 sets • Each array has 4 randomly placed replicates of each EST • Each control versus stress comparison was done on 4 arrays — A and B; flip dyes; A and B • Total of 16 replicates of each EST in each comparison
Who’s Who Computer Science Plant Biology Virginia Tech Ruth Alscher Plant Stress Lenwood Heath (CS) Algorithms Virginia Tech Dawei Chen Molecular Biology Bioinformatics Boris Chevone Plant Stress Naren Ramakrishnan (CS) Data Mining Problem Solving Environments Ron Sederoff, Ross Whetten Len van Zyl Y-H.Sun Forest Biotechnology North Carolina State Univ. Craig Struble, Vincent Jouenne (CS) Image Analysis Ina Hoeschele (DS) Statistical Genetics Keying Ye (STAT) Bayesian Statistics Statistics Virginia Tech
Expresso People Ron Sederoff Craig Struble Lenny Heath Ruth Alscher Keying Ye Ross Whetten Vincent Jouenne Boris Chevone Len van Zyl Y-H .Sun Dawei Chen Naren Ramakrishnan
Hypotheses • There is a group of genes whose expression confers resistance to drought stress. • Expression of this group of genes is lower under severe than under mild stress. • Individual members of gene families show distinct responses to drought stress.
Selection of cDNAs for Arrays • 384 ESTs (xylem, shoot tip cDNAs of loblolly) were chosen on the basis of function and grouped into categories. • Major emphasis was on processes known to be stress responsive. • In cases where more than one EST had similar BLAST hits, all ESTs were used.
Expresso: A Problem Solving Environment for Microarray Experiment Design and Analysis • Integration of design and procedures • Integration of image analysis tools and statistical analysis • Connections to web databases and sequence alignment tools • The software Aleph was used for inductive logic programming (ILP).
Categories within Protective and Protected Processes Gene Expression Signal Transduction Protease-associated ROS and Stress Nucleus Environmental Change Protective Processes Cell Wall Related Trafficking Phenylpropanoid Pathway Secretion Cells Cytoskeleton Development Tissues Plant Growth Regulation Protected Processes Chloroplast Associated Metabolism Carbon Metabolism Respiration and Nucleic Acids Mitochondrion
A Note about Categories • Categories are not mutually exclusive; gene(s) may be assigned to more then one category. For example, heat shock proteins have been grouped under these different categories and subcategories • Abiotic stress – heat • Gene expression – post-translational processing – chaperones • Abiotic stress - chaperones
Drought Dehydrins, Aquaporins Heat Heat shock proteins (Chaperones) Abiotic Non-Plant Biotic Cytosolic ascorbate peroxidase Xenobiotics GSTs “Isoflavone Reductases” Chaperones Antioxidant Processes superoxide dismutase-Fe NADPH/Ascorbate/ Glutathione Scavenging Pathway superoxide dismutase-Cu-Zn Sucrose Metabolism Stress glutathione reductase Cellulose Protective Processes Cell Wall Related Arabionogalactan proteins Extensins and proline rich proteins Phenylpropanoid Pathway Hemicellulose Pectins Xylose 4-coumarate-CoA ligases Other Cell Wall Proteins Lignin Biosynthesis CCoAOMTs isoflavone reductases cinnamyl-alcohol dehydrogenase phenylalanine ammonia-lyases S-adenosylmethionine decarboxylases glycine hydromethyltransferases Categories within “Protective Processes”
Quality Control • Positive: LP-3, a loblolly gene known to respond positively to drought stress in loblloly pine, was included. • LP-3 was positive in the moist versus mild comparison, and unchanged in the moist versus severe comparison. • Negative: Four clones of human genes used as negative controls in the Arabidopsis Functional Genomics project were included. The clones did not respond.
Spot and Clone Analysis • Image Analysis: gridding, spot identification, intensity and background calculation, normalization • Statistics: • Fold or ratio estimation • Combining replicates • Higher-level Analysis: • Clustering methods • Inductive logic programming (ILP)
Current Status of Expresso • Completely automated and integrated • Statistical analysis • Data mining • Experiment capture in MEL • Current Work: Integrating • Image processing • Querying by semi-structured views • Expresso-assisted experiment composition
Future Directions Next Generation Stress Chips • Time course, short and long term, to capture gene expression events underlying “emergency” and adaptive events following drought stress imposition. • (Use all available ESTs for candidate stress resistance genes.) • Generate cDNA library from stressed seedlings. • Initiate modeling of kinetics of drought stress responses.
Microarray Data Analysis How to use microarrays to learn more about the influence of drought stress on gene expression? Where the biologists need the computer scientists. A. Confounding factors in the raw data 1. Limitations in accuracy (technique) 2. Biological variation (individuals) B. How to apply corrections for these confounding factors to maximize the predictive power of the data. C. Modeling regulatory networks.