Download
1 / 22
220 likes | 398 Views
Improving Interpretation in Gene Set Enrichment Analysis . Alex Lewin (Imperial College Centre for Biostatistics) Ian Grieve ( IC Microarray Centre) Elena Kulinskaya (IC Statistical Advisory Service). Introduction. Microarray experiment list of differentially expressed (DE) genes

E N D
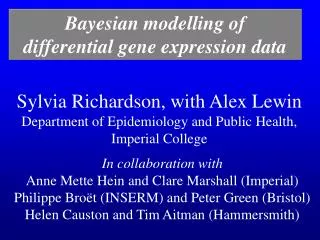
Improving Interpretation in Gene Set Enrichment Analysis Alex Lewin (Imperial College Centre for Biostatistics) Ian Grieve (IC Microarray Centre) Elena Kulinskaya (IC Statistical Advisory Service)
Introduction • Microarray experiment list of differentially expressed (DE) genes • Genes belong to categories of Gene Ontology (GO) • Are some GO categories (groups of genes) over-represented amongst the DE genes?
Contents • Grouping Gene Ontology categories can improve interpretation of gene set enrichment analysis • Fuzzy decision rules for multiple testing with discrete data
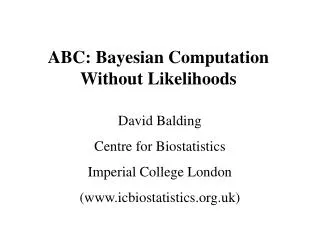
Gene Ontology (GO) Database of biological terms Arranged in graph connecting related terms: links from more general to more specific terms For each node, can define ancestor and descendant terms Directed Acyclic Graph ~16,000 terms from QuickGO website (EBI)
Gene Annotations • Genes/proteins annotated to relevant GO terms • Gene may be annotated to several GO terms • GO term may have 1000s of genes annotated to it (or none) • Gene annotated to term A annotated to all ancestors of A
DE not GO 22 467 not 173 7847 Find GO terms over-represented amongst differentially expressed genes For each GO term, compare: proportion of differentially expressed genes annotated to that term v. proportion of non-differentially expressed genes annotated to that term Fisher’s test p-value for each GO term. Multiple testing considerations threshold below which p-values are declared significant. Many websites do this type of analysis, eg FatiGO website http://fatigo.bioinfo.cnio.es/
Difficulties in Testing GO terms Interpretation: many terms close in the graph may be found significant – or not significant but many low p-values close together in the graph Statistical Power: many terms have few genes annotated Discrete statistics: p-values not Uniform under null
Grouping GO terms Use the Poset Ontology Categorizer (POSOC) Joslyn et al. 2004 Software which groups terms based on - pseudo-distance between terms - ‘coverage’ of genes Example: for data used here, reduces ~16,000 terms to 76 groups
Example: genes associated with the insulin-resistance gene Cd36 Knock-out and wildtype mice Bayesian hierarchical model gives posterior probabilities (pg) of being differentially expressed Most differentially expressed: pg > 0.5 (280 genes) Least differentially expressed: pg < 0.2 (11171 genes)
Example Results Individual term tests Used Fatigo website Multiple testing corrections (Benjamini and Hochberg FDR) done separately for each ‘level’ Found no GO terms significant when FDR controlled at 5% Group tests POSOC on all genes on U74A chip, gives 76 groups 3 groups found significant when controlling FDR at 5%
Comparison of Individual and Group Tests IA = immediate ancestor of significant POSOC group
Ranks high individually (smallest p-values) Biological process Physiological process` Response to stimulus Significant in group tests (and ranks high individually) Response to external stimulus Response to biotic stimulus Response to stress Organismal movement Response to other organism Defense response Response to wounding Response to pest, pathogen or parasite Immune response Inflammatory response Comparison of Individual and Group Tests
DE not GO X 467 not 173 7847 Discrete test statistics Null Hypothesis: X ~ HyperGeom(173, 7847-173, 467) X = 0,…,173 Null hypothesis determined by margins of 2x2 table Often very small no. possible values for cells • small no. possible p-values
DE not GO X 467 not 173 7847 Discrete test statistics p-value p(x) = P( X ≤ x | null ) P( p ≤α | null) ≠ α for most α
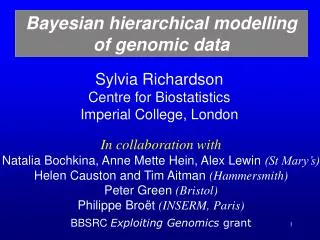
pprev pobs 1 0 Randomised Test Observe X=x0 pobs = observed p-value = P( X ≤ x0 | null ) pprev = next smallest possible p-value = P( X ≤ x0-1 | null ) Randomised p-value P(x0) = P( X < x0 | null ) + u*P( X = x0 | null ) where u ~ Unif(0,1) = pprev + u*(pobs- pprev) conditionally, P | x0 ~ Unif(pprev , pobs) unconditionally P ~ Unif(0,1)
1 pobs < α (α – pprev)/(pobs- pprev) pprev < α < pobs 0 pprev > α τα(pprev , pobs) = pprev pobs 1 0 Fuzzy Decision Rule Idea is to use all possible realisations of randomised test. Summarise evidence by critical function of randomised test: Use ταas a fuzzy measure of evidence against the null hypothesis. (Fuzzy decision rule considered by Cox & Hinckley, 1974 and developed by Geyer and Meeden 2005)
Fuzzy Decision Rules for Multiple Testing We have developed fuzzy decision rules for multiple tests (i = 1,…,m) Use Benjamini and Hochberg false discovery rate (BH FDR) τBHα(piprev, piobs) = P( randomised p-value i is rejected | null ) using BH FDR procedure For small no. tests we can calculate these exactly.
for j = 1,…,n { generate randomised p-values (i=1,…,m) Pij ~ Unif (piprev, piobs) perform BH FDR procedure Iij = } τBHα(piprev, piobs) = 1/n ΣjIij 1 if Pij rejected 0 else ^ Fuzzy Decision Rules for Multiple Testing τBHα(piprev, piobs) = P( randomised p-value i is rejected | null ) For large no. tests use simulations:
Results for Cd36 Example [1] "alpha = 0.05" pprev pval i.bonf i.bh tau POSOC group 1 1e-04 3e-04 1 1 1 response to pest, pathogen or parasite 2 1e-04 4e-04 1 1 1 response to wounding 3 2e-04 6e-04 1 1 1 immune response 4 7e-04 0.0079 0 0 0.297 digestion 5 0.003 0.0122 0 0 0.021 chemotaxis 6 0.0039 0.0209 0 0 0.002 organic acid biosynthesis 7 0.0092 0.0306 0 0 0 synaptic transmission 8 5e-04 0.0436 0 0 0.059 response to fungi [1] "alpha = 0.15" pprev pval i.bonf i.bh tau POSOC group 1 1e-04 3e-04 1 1 1 response to pest, pathogen or parasite 2 1e-04 4e-04 1 1 1 response to wounding 3 2e-04 6e-04 1 1 1 immune response 4 7e-04 0.0079 0 1 1 digestion 5 0.003 0.0122 0 0 0.943 chemotaxis 6 0.0039 0.0209 0 0 0.661 organic acid biosynthesis 7 0.0092 0.0306 0 0 0.375 synaptic transmission 8 5e-04 0.0436 0 0 0.391 response to fungi
pprev pobs Results for Cd36 Example Order of fuzzy decisions is not the same as order of observed p-values Depends on amount of discreteness of null
Conclusions • Grouping Gene Ontology categories can help find significant regions of the GO graph • Fuzzy decision rules for multiple testing with discrete data can provide more candidates for rejection
Acknowledgements Acknowledgements Cliff Joslyn (Los Alamos National Laboratory) Tim Aitman (IC Microarray Centre) Sylvia Richardson (IC Centre for Biostatistics) BBSRC ‘Exploiting Genomics’ grant (AL) Wellcome Trust grant (IG) References Joslyn CA, Mniszewski SM, Fulmer A and Heaton G (2004), The Gene Ontology Categorizer, Bioinformatics 20, 169-177. Geyer and Meeden (2005), Fuzzy Confidence Intervals and P-values, Statistical Science, to appear.