Download
1 / 39
390 likes | 415 Views
This research presents the significance of Statewide Longitudinal Data Systems (SLDS) in Wyoming's workforce development. It discusses the challenges faced in the education system and the role of Labor Market Information (LMI) in addressing them.

E N D
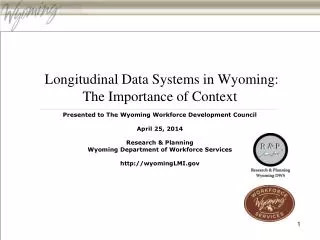
Longitudinal Data Systems in Wyoming:The Importance of ContextPresented to The Wyoming Workforce Development CouncilApril 25, 2014Research & PlanningWyoming Department of Workforce Serviceshttp://wyomingLMI.gov
Agenda Supply, Demand, and Intervention into the Labor Market -Michele Holmes’ Presentation, WWDC, Feb. 2014
Agenda: LMI and SLDSInterventions into the Labor Market - Labor Market Information (LMI) is established LMI has the tools and methods, which is why we are involved in the development of the SLDS. We are going to use our tools and methods to demonstrate what an SLDS can become - Statewide Longitudinal Data Systems (SLDS) are emergent
LMI and SLDS: What is the Problem? • Wyoming’s average per-pupil spending in 2011-12 was fifth highest of all 50 states.1 • Wyoming’s 79% graduation rate in 2011-12 ranked 28th among all 50 states.2 • "We're spending a huge amount of money on education, and don't feel like we're getting the results we want." - Sen. Hank Coe, R-Cody.3 • "We invest a tremendous amount in our children. If we're not graduating the students, then we're not getting that return on investment.“ – Sen. Chris Rothfuss, D-Laramie.3 1Source: 2011 Annual Survey of School System Finances. (2012). U.S. Census Bureau. 2Source: Regulatory Adjusted Cohort Graduation Rate, All Students: 2011-12. (2014). U.S. Department of Education. 3Source: Todd, L. (2014, July 14). In the nation's fifth biggest education spender, 1 in 5 Wyoming students will not graduate. Casper Star-Tribune.
LMI and SLDS: What is the Problem? Legislative Responses to Campbell I through IV Supreme Court Rulings 2011-12 School Year: • Only four states and the District of Columbia spent more per pupil than Wyoming • 27 states had higher graduation rates than Wyoming 1Source: 2011 Annual Survey of School System Finances. (2012). U.S. Census Bureau. 2Source: Regulatory Adjusted Cohort Graduation Rate, All Students: 2011-12. (2014). U.S. Department of Education. Note: The U.S. Department of Education did not publish graduation rates for the U.S., ID, KY, OK, or PR.
U.S. Unemployment Rate by Education Level *Source: Shierholz, H. (2014). Is There Really a Shortage of Skilled Workers? Economic Policy Institute.
Intermission Questions?
What is Labor Market Information (LMI)? - "Labor Market Information (LMI) is an applied science; it is the systematic collection and analysis of data which describes and predicts the relationship between labor demand and supply." The States' Labor Market Information Review, ICESA, 1995, p. 7. - The Research & Planning (R&P) section of the Wyoming Department of Workforce Services is Wyoming’s LMI shop. Meaning is a function of context. Description Prediction
What is a Statewide Longitudinal Data System?2005: $700 million SLDS competitive grants (Federal) May 2012: “The Institute of Education Sciences (IES) is pleased to announce today 24 new state-level grants to support the design and implementation of Statewide Longitudinal Data Systems (SLDS). The 2012 winners include eight first-time SLDS grantees: Delaware, Oklahoma, New Jersey, South Dakota, Vermont, West Virginia, Puerto Rico, and the U.S. Virgin Islands. The design, development, and implementation of a statewide, longitudinal kindergarten through grade 12 (K-12) data system; The development and linking of early childhood data with the State’s K-12 data system; or The development and linking of postsecondary and/or workforce data with the State’s K-12 data system.” National Center for Education Statistics. (2012). http://nces.ed.gov
SLDS Grantee States • Alaska: $3.5 (2006); $4.0 (2012) • Arizona: $6.0 (2007); $5.0 (2012) • Arkansas: $3.3 (2006); $5.0 (2009); $9.8 (2009 ARRA) • California: $3.3 (2006); $6.0 (2009) • Colorado: $4.2 (2007); $17.4 (2009 ARRA) • Connecticut: $1.5 (2006); $2.9 (2009) • Delaware: $4.6 (2012) • District of Columbia: $5.7 (2007); $4.0 (2012) • Florida: $1.6 (2006); $2.5 (2009); $10.0 (2009 ARRA) • Georgia: $8.9 (2009) • Hawaii: $3.5 (2009); $3.4 (2012) • Idaho: $5.9 (2009); $3.1 (2012) • Illinois: $9.0 (2009); $11.9 (2009 ARRA) • Indiana: $5.2 (2007); $4.0 (2012) • Iowa: $8.8 (2009); $3.7 (2012) • Kansas: $3.8 (2007); $3.9 (2009); $9.1 (2009 ARRA) • Kentucky: $5.8 (2006); $2.9 (2009); $3.6 (2012) • Louisiana: $4.1 (2009) • Maine: $3.2 (2007); $7.3 (2009 ARRA) • Maryland: $5.7 (2006); $6.0 (2009); $4.0 (2012) • Massachusetts: $6.0 (2009); $13.0 (2009 ARRA) • Michigan: $3.0 (2006); $5.5 (2009); $10.6 (2009 ARRA) • Missouri: $9.0 (2009) • Montana: $5.8 (2009); $4.0 (2012) • Nebraska: $3.5 (2007); $4.4 (2012) • Nevada: $6.0 (2007); $4.0 (2012) • New Hampshire: $3.2 (2007); $5.0 (2012) • New Jersey: $4.0 (2012) • New York: $7.8 (2009); $19.7 (2009 ARRA) • North Carolina: $6.0 (2007); $3.6 (2012) • North Dakota: $6.7 (2009); $3.9 (2012) • Ohio: $2.9 (2009); $5.1 (2009 ARRA) • Oklahoma: $5.0 (2012) • Oregon: $4.7 (2007); $3.7 (2009); $10.5 (2009 ARRA) • Pennsylvania: $4.0 (2006); $6.1 (2009); $14.3 (2009 ARRA) • Puerto Rico: $4.7 (2012) • Rhode Island: $4.7 (2009); $4.0 (2012) • South Carolina: $5.8 (2006); $14.9 (2009 ARRA) • South Dakota: $3.0 (2012) • Tennessee: $3.2 (2006) • Texas: $7.9 (2009); $18.2 (2009 ARRA) • Utah: $4.6 (2007); $9.6 (2009 ARRA) • Vermont: $4.9 (2012) • Virginia: $6.0 (2007); $17.5 (2009 ARRA) • Virgin Islands: $2.6 (2012) • Washington: $5.9 (2009); $13.3 (2009 ARRA) • West Virginia: $4.8 (2012) • Wisconsin: $3.1 (2006); $5.6 (2009); $13.8 (2009 ARRA)
LMI and SLDS: R&P’s Involvement U.S. Department of LaborWorkforce Data Quality Initiative (WDQI) to support SLDS Development • Three-year grant • $722,000 • Awarded July 2013 • “Use longitudinal data to evaluate the performance of Federally and State supported education and job training programs.” • “Provide user-friendly information to consumers to help them select the education and training programs that best suit their needs.” Source: USDOL WDQI Solicitation for Workforce Grant Applications.
LMI and SLDS: Focus of Measurement *Source: Hathaway Student Scholarship Program Longitudinal Study, Chapter 95, Sec. 9, Session Laws of Wyoming 2008.
Intermission Questions?
LMI Purpose: Enhancing ChoicePotential Training Opportunities Survey Data Linked to Administrative Records Reference: Identifying Workforce Needs in Wyoming: A Systematic Approach. Presented to The Wyoming Workforce Development Council in Cheyenne, Wyo., on Feb. 12, 2014, by Michele Holmes.
SLDS Purpose • Provide education performance data to improve instruction quality • Facilitate intervention with struggling students • Track student progress over time. - Source: National Center for Education Statistics SLDS Purpose in Wyoming The Wyoming Accountability in Education Act (WAEA) charges the Wyoming Department of Education to “use existing data to establish longitudinal data systems linking student achievement with teachers of record and relevant school principals, as necessary for the statewide education accountability system.” - Source: Wyoming Accountability in Education Act, § 21-2-202
Wyoming’s Labor Market in Context “… labor markets do not respect county or state boundaries” (Leonard, 2010). • In 2009, at least 25% of all Unemployment Insurance (UI) benefits paid were to nonresidents (Leonard, 2010). • In Wyoming, out-of-state employers make up 27.3% of all employers and account for 55% of all employees (Quarterly Census of Employment and Wages [QCEW] 3/11/14 extract). • A 2008 survey of nurses in WY revealed that 58.4% were non-native (Retention of Nurses in Wyoming, 2008). • From 2004-2006 all of the net change in workers in WY came from nonresidents (Jones, 2007). What is Wyoming’s labor supply chain?
R&P Partner LMI Offices Reference: A Decade Later: Tracking Wyoming's Youth Into the Labor Force. Presented to the Wyoming Workforce Development Council on January 9, 2013, in Cheyenne, WY, by Tony Glover. • Data-sharing agreements with 10 LMI partner states. • MOU in progress with Ohio LMI office. • Ongoing discussions with North Dakota, Kansas, Minnesota, and Pennsylvania LMI offices.
Intermission Questions?
LMI and SLDS Research:Tools to Move From Description to Prediction
Tools to Move From Description to Prediction:Employment GrowthAuto Regressive Integrated Moving Average (ARIMA) Time series using 276 observations. 1Source: Wyoming Statewide Long Term Employment Projections: 2002-2012(http://doe.state.wy.us/LMI/proj2004/Wyoming_Report%203Dig%202012.pdf). 2Source: Quarterly Census of Employment and Wages (QCEW)(http://doe.state.wy.us/LMI/toc_202.htm)
Occupational Projections From Description to Prediction:Employment ProjectionsAuto Regressive Integrated Moving Average (ARIMA) Reference: Identifying Workforce Needs in Wyoming: A Systematic Approach. Presented to The Wyoming Workforce Development Council in Cheyenne, Wyo., on Feb. 12, 2014, by Michele Holmes.
Tools to Move From Description to Prediction:Unemployment Insurance (UI) Benefits Paid: 2006-2013Regression 104 observations over time.
Intermission Questions?
Tools To Move From Description to Prediction: DWS/USDOL Unemployment Insurance (UI) Profiling Program The purpose of regression analysis is to prevent UI benefit exhaustion by allocating scarce employment and training resources to claimants most in jeopardy. To intervene and prevent: • Employer UI Tax Increases • Worker Dislocation • Dependence on public support: SNAP, TANF, Medicaid, Housing Assistance, etc. …
Tools to Move From Description to Prediction: Regression AnalysisSLDS School District Vision
Student Record • Sally Port strips off Personal Information Identifiers (PII) • Replaces with system identification
How Are We Doing?- Dr. Mark Schneider, Former Commissioner of the National Center for Education Statistics, 2006-2009 Data Check In, but They Don’t Check Out “One of the mistakes we have made, and remember we are $700 million into the process, was that we did not have a use requirement…So what has happened is that we have made this huge investment in these data warehouses, which I think of…you remember there was something called the roach motel. You know roaches checked in, but they never checked out. So sometimes I think of these data systems as the equivalent. You know data checks in and we never see them again.” Source: Testimony of Dr. Mark Schneider to the Subcommittee on Higher Education and Workforce Training of the Committee of Education and the Workforce, U.S. House of Representatives, September 20, 2012.
Research & Planning Wyoming Department of Workforce ServicesP.O. Box 2760246 S. Center St. Casper, WY 82601(307) 473-3807 DWS-RESEARCHPLANNING@wyo.gov http://wyomingLMI.org Tom Gallagher, Manager tom.gallagher@wyo.gov