Sensor Characteristics
Learn about the innovative spectrometer technology in MODIS sensors, offering wide spectral coverage for cloud, sea, and land monitoring, with multiple lines per rotation and different spectral resolutions. Discover the benefits and limitations of spectrometer data, along with comparisons of performance parameters.

Sensor Characteristics
E N D
Presentation Transcript
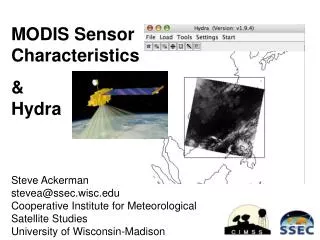
MODIS The MODerate resolution Imaging Spectrometer instrument (MODIS) the first operational space-based spectrometer. Its requirements for wide spectral coverage (VIS to LWIR) wide field of view, and a range of spectral resolutions resulted in a conventional line scanner design with multiple lines per rotation. Sensor Characteristics
MODIS (cont’d) Small linear arrays are located perpendicular to the scan direction with individual filters for each band. Multiple focal planes are used for the various detector materials. 8, 16, or 32 lines will be scanned per mirror sweep at 1000, 500, or 250 m nominal GIFOV. Sensor Characteristics
Sensors:Bandpass Filter Spectrometers –Line Scan/Whiskbroom • MODIS: Moderate Resolution Imaging Spectroradiometer Spectroradiometric calibrator Solar diffuser Main electronics module Blackbody reference Space view & lunar calibration port Double-sided scan mirror Radiative cooler Radiative cooler door & earth shield Aperture cover Thermal blanket Sensor Characteristics
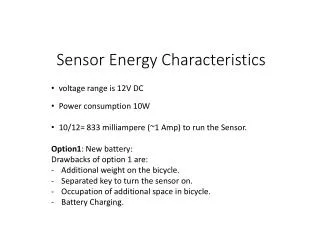
MODIS • 39 channels (36 bands 3 with 2 gains) • 1500 km swath • repeat coverage of the globe every 2 days • cloud, sea, and land monitoring http://modis.gsfc.nasa.gov/ Sensor Characteristics
MODIS (partial scene 3/6/00) Sensor Characteristics
The basic spectrometer designs are extensions of the whisk broom or line scanners and the push broom scanners Types of multispectral imaging systems Spectral Line Scanners (cont’d) Sensor Characteristics
Airborne Imaging Spectrometer Spectral Line Scanners (cont’d) One of the earliest experimental systems was NASA’s Airborne Imaging Spectrometer (AIS) flown in the mid 1980’s. It used the 2-d array design originally with a 32 x 32 element detector and later with a 64 x 64 element array (HgCdTe) operated from 1.2 - 2.4 and 0.8 - 2.4 respectively. Sensor Characteristics
Benefits of spectrometer data and the limitation of AIS as an imagerSpectral Line Scanners (con’t) Sensor Characteristics
Comparison of AIS-1 and AIS-2 performance parametersSpectral Line Scanners (cont’d) IFOV, mrad 1.91 2.05 Ground IFOV, m at 6-km altitude 11.4 12.3 FOV, deg 3.7 7.3 Swath width, m at 6-km altitude 365 787 Spectral sampling interval, nm 9.3 10.6 Data rate, kbps 394 1670 Spectral sampling Short-wavelength mode, m 0.9-2.1 0.8-1.6 Long-wavelength mode, m 1.2-2.4 1.2-2.4 Sensor Characteristics
AVIRISSpectral Line Scanners (cont’d) At that time, limitations in detector technology precluded a large array and still limit 2-D array approaches. NASA chooses a whisk broom array spectrometer for its follow-on research activity. The airborne visible infrared imaging spectrometer (AVIRIS) schematic design and conceptual approach are shown in the following figures Sensor Characteristics
Spectral Line Scanners Linear array Oscillating scan mirror Telescope Aperture Diffraction grating Scan Track Ground track Sensor Characteristics
Spectral Line Scanners • AVIRIS (airborne visible infrared imaging spectrometer) • MISI (Modular Imaging Spectrometer Instrument) • CASI Sensor Characteristics
Conceptual layout of the AVIRIS optical systemSpectral Line Scanners (cont’d) Sensor Characteristics
AVIRIS Performance characteristicsSpectral Line Scanners (cont’d) Parameter Performance Spectral coverage 0.4-2.45 Spectral sampling interval, nm 9.6-9.9 Number of spectral bands 224 IFOV, mrad 0.95 Ground IFOV, m at 20-km altitude 20 FOV, deg 30 Swath width, km at 20-km altitude 10.5 Number of cross-track pixels 614 Data encoding, bits 10 Data rate, Mbps 17 Radiometric calibration accuracy, % Absolute 6 Spectral band-to-band 0.5 Spectral calibration accuracy, nm 1-2 Sensor Characteristics
AVIRIS image cube of Moffet Field, CASpectral Line Scanners (cont’d) • 224 channels • .4 m to 2.5 m • spectral bandwidth • ~10 nm (Image courtesy of NASA JPL.) Sensor Characteristics
AVIRIS signal-to-noise Sensor Characteristics
AVIRIS SceneLake Ontario Shoreline RochesterEmbayment May 20, 1999 Sensor Characteristics
MISI (Modular Imaging Spectrometer Instrument)Spectral Line Scanners (cont’d) Sensor Characteristics
Modular Imaging Spectrometer Instrument (MISI) Airborne line scanner 70 VNIR channels 5 thermal channels Nominal 2 milliradian FOV (20ft GSD at 10000ft) Sharpening bands in VIS and LWIR spectrometers thermal focal plane On-board blackbody scan mirror Sensor Characteristics
MISI image of nuclear power plant discharge into Lake Ontario September 3, 1999 Three of MISI’s 70 VNIR channels thermal Sensor Characteristics
Ginna Power Plant Charlotte Pier MISI Examples Irodequoit Bay Sensor Characteristics
Push Broom Dispersion Systems AIS (diffraction grating) HYDICE (prism) SEBASS (prism) Hyperion (EO-1) Diffraction grating Pushbroom axis Spectral axis Collimator Slit Area arrays Optics GroundTrack
HYDICE SensorPush Broom Dispersion Systems (con’t) The Hyperspectral Digital Imagery Collection Experiment (HYDICE) uses a 2-d array push broom approach with a prism monochromator. The optical layout is on the following slide. The system is a technology demonstration airborne test bed for future satellite systems. The optics are designed to fit in a mapping camera mount. Sensor Characteristics
HYDICE SensorPush Broom Dispersion Systems (con’t) The system IFOV is 0.5 m rad and flies in a C141 at 2 to 14 km (nominal 6) with a GIFOV of 1 to 7 meters. The FOV is 8.94 degrees yielding coverage of 0.3 to 2.2 km. Sensor Characteristics
HYDICE SensorPush Broom Dispersion Systems (con’t) The prism design yields variable spectral bandwidth as shown in Figure 2. The bandwidth in the blue channels will be increased by averaging in the spectral direction at the extreme end of the blue to maintain a nominal bandwidth of approximately 10 nm. Sensor Characteristics
HYDICE SensorPush Broom Dispersion Systems (con’t) Fig 2. Spectral bandwidth (FWHM) as a function of wavelength Sensor Characteristics
HYDICE SensorPush Broom Dispersion Systems (con’t) The wide spectral range from 0.4 - 2.5 µm is achieved with a single cooled InSb detector (65K) array as shown in Figure 3. Special passivation and anti reflection coating were developed to maintain acceptable sensitivity and SNR over the entire range. Sensor Characteristics
HYDICE SensorPush Broom Dispersion Systems (con’t) Fig 3. Focal plane array architecture Sensor Characteristics
HYDICE SensorPush Broom Dispersion Systems (con’t) The expected HYDICE SNR is shown in Figure 4 for its spec point of a 5% reflector (N.B. this system was designed for water sensors.) Sensor Characteristics
SEBASS Sensor HighlightsPush Broom Dispersion Systems (con’t) • Spatially Enhanced Broadband Array Spectrograph System • Developed by the Aerospace Corporation • Prototype Hyperspectral Infrared Sensor • Material Identification using 3-5 and 8-14 µm signatures Sensor Characteristics
SEBASS Sensor GeometryPush Broom Dispersion Systems (con’t) • Pushbroom Scanner • Disperses line image into its spectral components • Detectors are 128x128 pixel “Blocked Impurity Band” • manufactured by Rockwell International • Built as part of NASA SIRTF effort • Spatial Resolution of 0.5 and 3 meters • @1500 and 10000 feet respectively • 1 milliradian per pixel IFOV (~7 degrees FOV) Sensor Characteristics
Spectral purity issues:spatial/temporal/sensor artifacts (smile) The SEBASS Sensor is a Pushbroom Scanner Sensor Characteristics
Spectral purity issues:spatial/temporal/sensor artifacts (smile) Push Broom Dispersion Systems Diffraction grating Pushbroom axis Spectral axis Collimator Slit Area arrays Optics GroundTrack Sensor Characteristics
Spectral purity issues:spatial/temporal/sensor artifacts (smile) Sensor Characteristics
Linear Wedge Filter SpectrometerAtmospheric Corrector on EO-1 2D array wedge interference filter wedge filter side view of filter Sensor Characteristics
Fourier transform instruments At longer wavelengths, the spectral features become very narrow. This is particularly important in the 8-14 µm region where many gaseous absorption features are manifest. It can be difficult to achieve sufficient spectral resolution at these wavelengths. In the laboratory Fourier, transform spectrometers are often used for detailed characterization of the spectra at these wavelengths. Sensor Characteristics
Fourier transform instruments Fig 1. IFTS raw data cube Sensor Characteristics
Fourier transform instruments Figure 1 shows the concept behind an FTIR imaging spectrometer where a 2-d array is located at the image plane (interference plane). Each spatial 2-d sample represents a different time sample corresponding to a different location of the moving mirror in the interferometer and, therefore, a different interference pattern. For any pixel, the Fourier transform of the interference samples (interferogram) is the spectrum for that pixel. Thus, from the interferogram image cube, a conventional spectral image cube can be created by a 1-dimensional Fourier transform of each pixel. Sensor Characteristics
Fourier transform instruments Fig 2. A sketch of the optics of an Imaging Fourier Transform Spectrometer Sensor Characteristics
Fourier transform instruments Figure 2 shows a conceptual diagram of an FTIR imaging instrument. The object plane would typically be the focal plane of the conventional collection optics. The 2-d array is located at the image plane. The primary advantage of the imaging FT instrument is that spectral resolution is primarily a function of the number of samples taken. Therefore, high spectral resolution can be achieved without great cost in detector technology. Sensor Characteristics
Fourier transform instruments Note a major drawback of this approach is the assumption of constant FOV during motion of the mirror. Sensor Characteristics
Fourier transform instruments • Many variations in design of IFTS available • Michelson • Collects spectral information over time • Spatial information collected like an image • Sagnac • Spectral information collected spatially (over one FPA dimension) • Spatial info collected over other FPA dimension + pushbroom scanning Sensor Characteristics
Fixed Mirror y f Moving Mirror Object Plane f’ Image Plane y’ Michelson Interferometer • Frame camera • Must stare at one point during the collection time • Interferogram collection method • Collect interference image • Move mirror (change OPD) • Change view angle • Repeat Sensor Characteristics
Michelson Interferometer • Input spectrum changes with view angle and pointing accuracy • Collects one slice of image cube at every time interval Sensor Characteristics
Aperture Mirrors Telescope focus Spherical lens Cylindrical lens Beam splitter detector Sagnac Interferometer • Pushbroom Scanner • Collect entire interferogram over one axis of the FPA • Each interferogram is collected instantaneously • Examples • FTHSI on MightySat II.1 • MTU sensor for water quality of GL Sensor Characteristics
Spectral databases – mixed pixels • Lab & Field Spectra – (diffuse hemispheric- BDRF ASD) • USGS • EOS • ASTER Spectral Library • http://speclib.jpl.nasa.gov Sensor Characteristics
from: ASTER Spectral Library http://speclib.jpl.nasa.gov Sensor Characteristics
ASD FieldSpec 1.0 Grass Brick asphalt roofing Sensor Characteristics