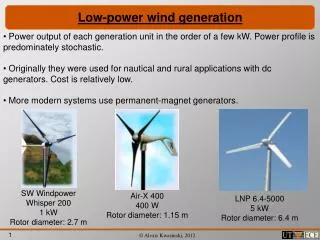
MAXIMUM POWER GENERATION USING WIND POWER PLANTS
IGEC-2 INTERNATIONAL GREEN ENERGY CONFERENCE. YILDIZ TECHNICAL UNIVERSITY. MAXIMUM POWER GENERATION USING WIND POWER PLANTS. Pr e pared by: Nur Bekiroglu Zehra Yumurtacı Bedri Kekezoğlu. IGEC-19 8. IGEC-2 INTERNATIONAL GREEN ENERGY CONFERENCE. YILDIZ TECHNICAL UNIVERSITY.

MAXIMUM POWER GENERATION USING WIND POWER PLANTS
E N D
Presentation Transcript
IGEC-2 INTERNATIONAL GREEN ENERGY CONFERENCE YILDIZ TECHNICAL UNIVERSITY MAXIMUM POWER GENERATION USING WIND POWER PLANTS Prepared by: Nur Bekiroglu Zehra Yumurtacı Bedri Kekezoğlu IGEC-198
IGEC-2 INTERNATIONAL GREEN ENERGY CONFERENCE YILDIZ TECHNICAL UNIVERSITY INTRODUCTION Today, due to increasing population and industrialization, in developing countries, energy demand can not be met with existing limited sources; therefore the great difference between energy production and consumption becomes even larger. In that situation, it becomes very important for the country to utilize its own resources with higher efficiency. On the other hand, when the disadvantages of conventional energy production methods are taken into consideration, the importance of renewable energy sources is significant. Among the renewable energy sources, wind has a significant importance as it is clean, environment-friendly, and continuous and has relatively lower costs. IGEC-198
IGEC-2 INTERNATIONAL GREEN ENERGY CONFERENCE YILDIZ TECHNICAL UNIVERSITY INTRODUCTION A lot of regions in the world have wind powered electricity generation potential. It is considered that the wind energy potential of the area in between the 50° North and South latitudes is 26000 TWh/year and due to economical and other reasons, 9000 TWh/year capacities is utilizable. According to the studies conducted, it is concluded that 27% of the terrestrial area of the earth encounters 5,1 m/s of annual average wind speed. It is calculated that if this potential is employed, 8 MW/km2 production capacities and a 240000 GW installed power will be achieved. IGEC-198
IGEC-2 INTERNATIONAL GREEN ENERGY CONFERENCE YILDIZ TECHNICAL UNIVERSITY Fig.1. Increase of the installed power values of the wind power plants in the world. (American Wind Energy Association and European Wind Energy Association) INTRODUCTION IGEC-198
IGEC-2 INTERNATIONAL GREEN ENERGY CONFERENCE YILDIZ TECHNICAL UNIVERSITY INTRODUCTION Figure 1 shows the increase of the installed power values of the wind power plants in the world and Table 1 shows distribution of installed power over the countries. It also shows that world’s wind power potential is high and there are countries that use almost all their potential, as well as there are countries that can not use their potential. Figure 2 shows the distribution of the installed power over the continents. Table 2 shows the distribution of technical potential in European countries IGEC-198
IGEC-2 INTERNATIONAL GREEN ENERGY CONFERENCE YILDIZ TECHNICAL UNIVERSITY Fig.2. Distribution of the installed power over the continents (European Wind Energy Association INTRODUCTION IGEC-198
IGEC-2 INTERNATIONAL GREEN ENERGY CONFERENCE YILDIZ TECHNICAL UNIVERSITY Table 1. Shares of installed wind power in the world. (World Wind Energy Association) INTRODUCTION IGEC-198
IGEC-2 INTERNATIONAL GREEN ENERGY CONFERENCE YILDIZ TECHNICAL UNIVERSITY Table 2.Technical potential for wind power in Europe countries. ( www.mmoistanbul.org) INTRODUCTION IGEC-198
IGEC-2 INTERNATIONAL GREEN ENERGY CONFERENCE YILDIZ TECHNICAL UNIVERSITY INTRODUCTION In order to compete within the electricity market, wind power plants must be able to produce electricity with costs that can be compared to fossil fuel production method costs. Since wind has no cost itself, all the investment costs in such systems consist of the mechanical and electrical parts. Parallel to technological development in the area, turbine costs have decreased and produced total energy has increased. Table 3 shows the estimated variations of costs for years. IGEC-198
IGEC-2 INTERNATIONAL GREEN ENERGY CONFERENCE YILDIZ TECHNICAL UNIVERSITY Table 3. Wind power technology, past, present and future (American Wind Energy Association) INTRODUCTION IGEC-198
IGEC-2 INTERNATIONAL GREEN ENERGY CONFERENCE YILDIZ TECHNICAL UNIVERSITY All the factors that affect wind power turbine design, construction and operation, are in balance with cost component. INTRODUCTION All the studies consulted nowadays are in order to decrease the wind power costs to 0,024$ levels by the year 2010. Therefore wind power will be competitive with conventional energy sources. The unit cost of the energy produced by the wind power plants vary according to the wind speed. It is known that as the wind speed increases, the unit cost of the energy produced decreases. As the applications in the USA are analyzed, the change of unit energy cost with wind speed is as in Fig.3. In EU countries, these values are calculated as 9,6 cent/kWh for 5 m/s wind speed and 3,4 cent/kWh for 10 m/s (European Wind Energy Association ). IGEC-198
IGEC-2 INTERNATIONAL GREEN ENERGY CONFERENCE YILDIZ TECHNICAL UNIVERSITY Fig.3. Change of unit energy cost with wind speed (www.awea.org) INTRODUCTION IGEC-198
IGEC-2 INTERNATIONAL GREEN ENERGY CONFERENCE YILDIZ TECHNICAL UNIVERSITY In this study, the wind speed data of point marked with X in Figure 4, which is Çeşme-Kocadağ, on the Aegean Sea coast of İzmir-Turkey. The data is also given in Table 4. Wind speed data used in this study Fig.4. Location of Kocadağ point (www.eie.gov.tr) IGEC-198
IGEC-2 INTERNATIONAL GREEN ENERGY CONFERENCE YILDIZ TECHNICAL UNIVERSITY Table 4. Annual and monthly wind speeds at Kocadağ Point Wind speed data used in this study IGEC-198 (N/A: Not Available) (www.eie.gov.tr)
IGEC-2 INTERNATIONAL GREEN ENERGY CONFERENCE YILDIZ TECHNICAL UNIVERSITY Wind speed data used in this study These values are the data given by Electrical Power Resources Survey and Development Administration-Turkey. The average of these speed values are given in Figure 5. When the data given in Table 4 is analyzed, the monthly wind speed variation given in Figure 5 is obtained. Then the average speed value is calculated to be 8,4 m/s. IGEC-198
IGEC-2 INTERNATIONAL GREEN ENERGY CONFERENCE YILDIZ TECHNICAL UNIVERSITY Fig.5. Monthly wind speed variation of Kocadağ Point Wind speed data used in this study IGEC-198
IGEC-2 INTERNATIONAL GREEN ENERGY CONFERENCE YILDIZ TECHNICAL UNIVERSITY The power that can be generated by the turbine is expressed as follows; MATHEMATICAL MODEL OF WIND TURBINES (W) (1) : Specific weight of the air (kg/m3) R : Turbine radius (m) v : Wind speed (m/s) Cp : Power coefficient Cp is related to the limit speed indicated by , and is maximum at a specific turbine speed under different wind speeds. Therefore, the point that Cp is maximum (Cpmax=0,3-0,5) is the point that the present wind gives maximum power (Muljadi et al., 1999). IGEC-198
IGEC-2 INTERNATIONAL GREEN ENERGY CONFERENCE YILDIZ TECHNICAL UNIVERSITY Tip speed ratio is given as; MATHEMATICAL MODEL OF WIND TURBINES (2) Here ; is the angular speed of the shaft. Torque of the wind turbine is given as: (Nm) (3) Here, Ct is torque coefficient and is defined as; (4) Cp = Ct IGEC-198
IGEC-2 INTERNATIONAL GREEN ENERGY CONFERENCE YILDIZ TECHNICAL UNIVERSITY For constant pitch angle the variation of power coefficient Cp versus tip speed ratio is given in Fig. 6. MATHEMATICAL MODEL OF WIND TURBINES Fig.6. Variation of Cp with . (Duru, T., et al., 2003) IGEC-198
IGEC-2 INTERNATIONAL GREEN ENERGY CONFERENCE YILDIZ TECHNICAL UNIVERSITY In wind turbines where the wind speed is constant and under high power, synchronous generators are preferred. However, since wind characteristics are usually variable, the component to generate electrical energy needs to have similar characteristics. MATHEMATICAL MODEL OF THE INDUCTION GENERATOR Since the induction generators are capable of generation electricity both under constant and variable speeds, squirrel cage induction machines are widely used as generators (Orabi et al., 2004). As the induction machine works as a generator, magnetizing current and the reactive power needed are supplied by the source and convert the mechanical power of the shaft into electrical power to feed the source. Under constant frequency, working as a generator takes place only over synchronous speed. In order to obtain constant amplitude and frequency, generator output is supported with converter, inverter, filter and rectifier. IGEC-198
IGEC-2 INTERNATIONAL GREEN ENERGY CONFERENCE YILDIZ TECHNICAL UNIVERSITY Using a frequency controller the asynchronous machine can be used as a generator under every speed. MATHEMATICAL MODEL OF THE INDUCTION GENERATOR Induction generators are preferred due to their low costs, simple structures, high efficiency values, and for being safe, without electromagnetic oscillations. In the case that an induction machine is employed as a generator, efficiency can be obtained at levels up to 82% under full load. A three phase, squirrel cage induction motor, can be used as a self-excited generator with the capacitor group connected to the stator coil ends. Initial speed of the excitation by the capacity depends on the residual magnetism values of the rotor. IGEC-198
IGEC-2 INTERNATIONAL GREEN ENERGY CONFERENCE YILDIZ TECHNICAL UNIVERSITY The residual magnetism of an induction motor previously worked connected to the network induces an EMF to the stator coils depending on the speed, and current passes through the capacitors (Seyoum et al., 2003). MATHEMATICAL MODEL OF THE INDUCTION GENERATOR If the capacitors are empty and without any load, voltage increases in relation with the speed and time, capacity and saturation value of the stator metal core. Initial speed is now dependant to residual magnetism but the excitation velocity can be reduced by increasing the capacitor values. Even if the values of the excitation capacitors are increased, after a specific frequency, the voltage starts decreasing. This shows that the iron core has reached saturation. After that value, excitation capacitors behave as a load. IGEC-198
IGEC-2 INTERNATIONAL GREEN ENERGY CONFERENCE YILDIZ TECHNICAL UNIVERSITY In this study, self-excited, three phases, squirrel cage induction machine is used as a generator driven by the wind turbine shaft. Equivalent circuit of the self-excited induction generators reduced to one phase is given in Figure 7. MATHEMATICAL MODEL OF THE INDUCTION GENERATOR Fig.7. Equivalent circuit of the induction generators IGEC-198
IGEC-2 INTERNATIONAL GREEN ENERGY CONFERENCE YILDIZ TECHNICAL UNIVERSITY MATHEMATICAL MODEL OF THE INDUCTION GENERATOR RS ; Stator resistance (ohm) RR; Rotor resistance jXS; stator reactance (ohm) jXR; rotor reactance (ohm) Rm ; magnetization resistance (ohm) jXm ; magnetization reactance jXc ; excitation capacitance s ; slip, and is defined as: (5) IGEC-198
IGEC-2 INTERNATIONAL GREEN ENERGY CONFERENCE YILDIZ TECHNICAL UNIVERSITY S; synchronous angular velocity MATHEMATICAL MODEL OF THE INDUCTION GENERATOR R; rotor angular velocity and since while the generator is working, slip is negative. Stator voltage expression of a squirrel cage induction machine, is as follows: (V) (6) VS ; stator voltage IS ; stator current LS ; stator inductance MS,R ; mutual inductance S ; stator flux IGEC-198
IGEC-2 INTERNATIONAL GREEN ENERGY CONFERENCE YILDIZ TECHNICAL UNIVERSITY The rotor voltage is defined as MATHEMATICAL MODEL OF THE INDUCTION GENERATOR (V) (7) IR ; rotor current LR ; rotor inductance MS,R ; mutual inductance S ; stator flux Motion equation of the mechanical part is described in equation (8) J; being inertia coefficient ; being viscous friction coefficient (Nm) (8) IGEC-198
IGEC-2 INTERNATIONAL GREEN ENERGY CONFERENCE YILDIZ TECHNICAL UNIVERSITY The value that makes the power expression in Equation (1) maximum is the point that Cp is maximum.This value is calculated to be 0,495 for =7 by using Figure 6. CALCULATING MAXIMUM TURBINE POWER UNDER DIFFERENT WIND SPEEDS The air density is 1,2 kg/m3. The turbine radius in this study is selected as 15 m. Using the average wind speeds for Kocadağ given in Table 4, maximum power values are calculated using Eq.1. In this study, bound to shaft speed and under various wind speeds, the variations of the turbine power are obtained. Under different speeds, maximum power points are determined and Pmax= f () is obtained. That variation shown in Fig. 8, ensures Pt = a 2 where “a” is a constant (Muljadi et al., 2001). IGEC-198
IGEC-2 INTERNATIONAL GREEN ENERGY CONFERENCE YILDIZ TECHNICAL UNIVERSITY Fig. 8. Turbine power variation bound to the shaft speed under different wind speed values. CALCULATING MAXIMUM TURBINE POWER UNDER DIFFERENT WIND SPEEDS IGEC-198
IGEC-2 INTERNATIONAL GREEN ENERGY CONFERENCE Wind Turbine Induction Generator Load Rotor Speed Excited capacity YILDIZ TECHNICAL UNIVERSITY The block diagram of the system used for simulation is given in Fig.9. MODELING THE WIND TURBINE-INDUCTION GENERATOR GROUP OF THE DESIGNED SYSTEM Fig.9. Block diagram used. IGEC-198
IGEC-2 INTERNATIONAL GREEN ENERGY CONFERENCE YILDIZ TECHNICAL UNIVERSITY MODELING THE WIND TURBINE-INDUCTION GENERATOR GROUP OF THE DESIGNED SYSTEM As a result of the simulation conducted using the block diagram given in Figure 9, power curves shown in Figure 10 are obtained. Power variations for each wind speed value are given. Fig.10. Power variations for different wind speeds Wind speed: 6,9 m/s IGEC-198
IGEC-2 INTERNATIONAL GREEN ENERGY CONFERENCE YILDIZ TECHNICAL UNIVERSITY Wind speed: 7,8 m/s MODELING THE WIND TURBINE-INDUCTION GENERATOR GROUP OF THE DESIGNED SYSTEM Wind speed: 8,4 m/s IGEC-198
IGEC-2 INTERNATIONAL GREEN ENERGY CONFERENCE YILDIZ TECHNICAL UNIVERSITY Wind speed: 8,6 m/s MODELING THE WIND TURBINE-INDUCTION GENERATOR GROUP OF THE DESIGNED SYSTEM Wind speed: 9,8 m/s IGEC-198
IGEC-2 INTERNATIONAL GREEN ENERGY CONFERENCE YILDIZ TECHNICAL UNIVERSITY In this study, calculations are conducted according to the monthly wind speed values given by EIE (Electrical Power Resources Survey and Development Administration, Turkey) for İzmir Cesme Kocadağ wind observation station. MODELING THE WIND TURBINE-INDUCTION GENERATOR GROUP OF THE DESIGNED SYSTEM These speed values are used in a turbine-asynchronous generator simulation prepared on MATLAB software and power values are calculated. Wind turbine radius is assumed to be 15 m. It is known that the power coefficient is maximum at the point that maximum power is obtained. Therefore, in this study, using Figure 6, maximum power coefficient of 0,495 that corresponds to limit speed value 7, is used. Theoretical and simulation results show that the selected system is capable of obtaining maximum power under different wind speed values. IGEC-198
IGEC-2 INTERNATIONAL GREEN ENERGY CONFERENCE YILDIZ TECHNICAL UNIVERSITY Using the software prepared with MATLAB, maximum power for each wind speed value is determined and illustrated with graphics. MODELING THE WIND TURBINE-INDUCTION GENERATOR GROUP OF THE DESIGNED SYSTEM Under minimum wind speed of 6,9 m/s, the calculated power is 69 kW, simulation results give 70,5 kW power. Under annual average wind speed of 8,4 m/s Calculated power is 124,5 kW Simulation results give approximately 120 kW Under maximum wind speed of 9,8 m/s Calculated power is 197,7 kW Simulation results give 189,4 kW. IGEC-198
IGEC-2 INTERNATIONAL GREEN ENERGY CONFERENCE YILDIZ TECHNICAL UNIVERSITY MODELING THE WIND TURBINE-INDUCTION GENERATOR GROUP OF THE DESIGNED SYSTEM It is obvious that the calculation and simulation results are close. Therefore, the simulation shows the feasibility of a real turbine-asynchronous generator system. It is possible to use MATLAB simulation data to perform the design of the wind turbine plant. IGEC-198
IGEC-2 INTERNATIONAL GREEN ENERGY CONFERENCE YILDIZ TECHNICAL UNIVERSITY THANK YOU Prepared by: Nur Bekiroglu nbekir@yildiz.edu.tr Zehra Yumurtacı zyumur@yildiz.edu.tr Bedri Kekezoğlu bkekez@yildiz.edu.tr IGEC-198