Download
1 / 11
110 likes | 223 Views
Science, Technology and Environment Laboratory, Pedagogical Department P.E., University of Athens, Greece. Estimating the absolute zero through thermal expansion of air. Dimitrios Sotiropoulos , Sarantos Oikonomidis, Despoina Ponirou , Nikolaos Voudoukis, George Kalkanis. The aim.

E N D
Science, Technology and Environment Laboratory, Pedagogical Department P.E., University of Athens, Greece Estimating the absolute zero through thermal expansion of air Dimitrios Sotiropoulos,Sarantos Oikonomidis, Despoina Ponirou, NikolaosVoudoukis, George Kalkanis.
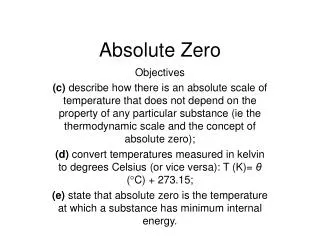
The aim We describe an educational hands-onactivity to estimate the absolute zero through the thermal expansion of air. The mainaim of the activity is that the students confirm experimentally the existence of a minimum temperature in nature. The students estimate absolute zero without using specializedsoftware or sensorsin the school laboratory.
Thematerials • a bottle • a lid with a hole • ice cubes • hot water • a syringe • a plumb • a small thermometer. • a volumetric cylinder
Pre- lab activities The students have accomplished a pre lab activity before their attendance in the laboratory. This is done in order to confirm that they have the theoretical background needed.
Hands-on activity • Put the thermometer inside the bottle, fill the bottle with water and put the lid on it. Then pour the water from the bottle to the volumetric cylinder. Estimate the air volume inside the bottle. Write it down on your worksheet. • The piston of the syringe has to be settled at 30mL. Use silicone to make the bottle air-proof. Glue a plumb on the top of the syringe.
Hands-on activity 3. Put the bottle in the cup and add the ice cubes. When the temperature reaches 0 οC, write down the volume of the syringe. 4. Remove the ice cubes andthrow boiled water over the bottle. When the syringe starts moving write down the volume of the syringe every 5 οC . Fill in all the tables on your worksheet.
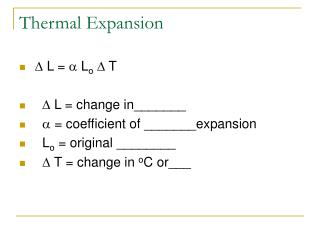
Data analysis • A worksheet is given to the students to write down the data that they collected concerning Volume and Temperature measurements. They fill the tables and then they have to do the volume-temperature chart. • Afterwards they estimate the inclination of the straight line of the V – T chart.
Data analysis The students have to answer the following question: How does temperature affect the air-volume in this isobaric process?
Data analysis The students have to estimate absolute zero from the chart they made.
Results The students of Pedagogical Departmentof Athens, calculated the slope of the line graph using DATAFIT2000 (software) and they estimated the value of absolute zero from the equation V=V0(1+βΤc).
Results By using theleast square method (using Εxcel or Datafit2000 software) the students calculated the slope of the line equal to V0 β =1,25 L/grad. Knowing that at absolute zero the volume is 0, from the relationship V=V0(1+βΤc)the students conclude that Τc=-V0 /V0 β. (this is the lowest temperature limit). The result of the estimation is T=-262 oC. The absolute fault compare to the real value is 11οC , while the relative fault is 4%.