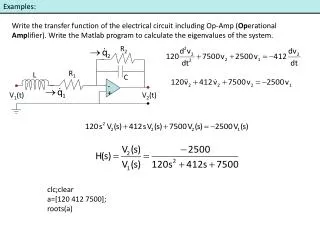
Options Trading Strategies: Understanding Covered, Spread, and Combination Approaches
This guide presents essential strategies in options trading, including covered strategies, spreads, and combinations. It details how to take positions in the underlying stock alongside options, explains the use of spreads in various scenarios, and outlines combinations that involve calls and puts. Additionally, it provides profit equations for different strategies, emphasizing the implications of stock price movements on potential profits. This comprehensive overview is tailored for traders seeking to enhance their understanding of options strategies effectively.


Options Trading Strategies: Understanding Covered, Spread, and Combination Approaches
E N D
Presentation Transcript
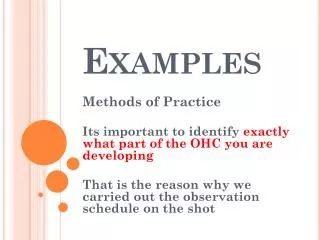
OPTIONS - EXAMPLES MILJAN KNEŽEVIĆ, BANJA LUKA - AUGUST 2010
SOME STRATEGIES • COVERED STRATEGIES: Take a position in the option and the underlying stock. • SPREAD STRATEGIES: Take a position in 2 or more options of the same type (A spread). • COMBINATION STRATEGIES: Take a position in a mixture of calls and puts. MILJAN KNEŽEVIĆ, BANJA LUKA - AUGUST 2010
TYPES OF STRATEGIES • STANDARD SYMBOLS: • C = current call price, P = current put price • S0 = current stock price, ST = stock price at time T • T = time to maturity • X = exercise price (or K in some books) • P = profit from strategy • STAKES: • NC = number of calls • NP = number of puts • NS = number of shares of stock MILJAN KNEŽEVIĆ, BANJA LUKA - AUGUST 2010
Types of Strategies • These symbols imply the following: • NC or NP or NS > 0 implies buying (going long) • NC or NP or NS < 0 implies selling (going short) • Recall the PROFIT EQUATIONS • Profit equation for calls held to expiration • P = NC[Max(0,ST - X) – Cexp(rT)] • For buyer of one call (NC = 1) this implies • P = Max(0,ST - X) - Cexp(rT) • For seller of one call (NC = -1) this implies • P = -Max(0,ST - X) + Cexp(rT) MILJAN KNEŽEVIĆ, BANJA LUKA - AUGUST 2010
Types of Strategies The Profit Equations (continued) • Profitequation for puts held to expiration • P= NP[Max(0,X - ST) - Pexp(rT)] • For buyer of one put (NP = 1) this implies P= Max(0,X - ST) - Pexp(rT) • For seller of one put (NP = -1) this implies P= -Max(0,X - ST) + Pexp(rT) MILJAN KNEŽEVIĆ, BANJA LUKA - AUGUST 2010
Types of Strategies • The Profit Equations (continued) • Profit equation for stock • P = NS[ST - S0] • For buyer of one share (NS = 1) this implies P= ST - S0 • For short seller of one share (NS = -1) this implies P= -ST + S0 MILJAN KNEŽEVIĆ, BANJA LUKA - AUGUST 2010
Positions in an Option & the Underlying Profit Profit K ST ST K (a) (b) Profit Profit K K ST ST (c) (d) MILJAN KNEŽEVIĆ, BANJA LUKA - AUGUST 2010
Bull Spread Using Calls Bull Spread Using Calls: Buying a call option on a stock with a particular strike price and selling a call option on the same stock with a higher strike price. Payoff from a Bull Spread: MILJAN KNEŽEVIĆ, BANJA LUKA - AUGUST 2010
Bull Spread Using Calls Ex: An investor buys $3 a call with a strike price of $30 and sells for $1 a call with a strike price of $35. Payoff from a Bull Spread: MILJAN KNEŽEVIĆ, BANJA LUKA - AUGUST 2010
Bull Spread Using Calls Profit ST K1 • K2 MILJAN KNEŽEVIĆ, BANJA LUKA - AUGUST 2010
Profit K1 K2 ST Bull Spread Using Puts MILJAN KNEŽEVIĆ, BANJA LUKA - AUGUST 2010
Profit K1 K2 ST Bear Spread Using Puts-buying one put with a strike price of K2 and selling one put with a strike price of K1 MILJAN KNEŽEVIĆ, BANJA LUKA - AUGUST 2010
Bear Spread Using Calls Bear Spread: Buying a call option on a stock with a particular strike price and selling a call option on the same stock with a lower strike price. MILJAN KNEŽEVIĆ, BANJA LUKA - AUGUST 2010
Bear Spread Using Calls Example: An investor buys a call for $1 with a strike price of $35 and sells for $3 a call with a strike price of $30. MILJAN KNEŽEVIĆ, BANJA LUKA - AUGUST 2010
Bear Spread Using Calls Profit K1 K2 ST MILJAN KNEŽEVIĆ, BANJA LUKA - AUGUST 2010
Box Spread • A combination of a bull call spread and a bear put spread • If all options are European a box spread is worth the present value of the difference between the strike prices • If they are American this is not necessarily so. MILJAN KNEŽEVIĆ, BANJA LUKA - AUGUST 2010
Butterfly Spread Using Calls • Butterfly Spread: buying a call option with a relative low strike price, K1,, buying a call option with a relative high strike price. K3, and selling two call options with a strike price halfway in between, K2. MILJAN KNEŽEVIĆ, BANJA LUKA - AUGUST 2010
Butterfly Spread Using Calls • Example: Call option prices on a $61 stock are: $10 for a $55 strike, $7 for a $60 strike, and $5 for a $65 strike. The investor could create a butterfly spread by buying one call with $55 strike price, buying a call with a $65 strike price, and selling two calls with a $60 strike price. MILJAN KNEŽEVIĆ, BANJA LUKA - AUGUST 2010
Butterfly Spread Using Calls Profit K1 K2 K3 ST MILJAN KNEŽEVIĆ, BANJA LUKA - AUGUST 2010
Butterfly Spread Using Puts Profit K1 K2 K3 ST MILJAN KNEŽEVIĆ, BANJA LUKA - AUGUST 2010
Calendar Spread Using Calls Profit ST K MILJAN KNEŽEVIĆ, BANJA LUKA - AUGUST 2010
Calendar Spread Using Puts Profit ST K MILJAN KNEŽEVIĆ, BANJA LUKA - AUGUST 2010
A Straddle Combination Straddle: Buying a call and a put with the same strike price and expiration Date. MILJAN KNEŽEVIĆ, BANJA LUKA - AUGUST 2010
A Straddle Combination Example: An investor buying a call and a put with a strike price of $70 and an expiration date in 3 months. Suppose the call costs $4 and the put $3. MILJAN KNEŽEVIĆ, BANJA LUKA - AUGUST 2010
A Straddle Combination Profit K ST MILJAN KNEŽEVIĆ, BANJA LUKA - AUGUST 2010
Strip & StrapStrip: combining one long call with two long putsStrap: combining two long calls with one long put Profit Profit K ST K ST Strip Strap MILJAN KNEŽEVIĆ, BANJA LUKA - AUGUST 2010
A Strangle Combinationbuying one call with a strike price of K2 and buying one put with a strike price of K1 Profit K1 K2 ST MILJAN KNEŽEVIĆ, BANJA LUKA - AUGUST 2010
BINOMIAL MODELS - EXAMPLES • A stock price is currently $20 • In three months it will be either $22 or $18 Stock Price = $22 Stock price = $20 Stock Price = $18 MILJAN KNEŽEVIĆ, BANJA LUKA - AUGUST 2010
A Call Option A 3-month call option on the stock has a strike price of 21. Stock Price = $22 Option Price = $1 Stock price = $20 Option Price=? Stock Price = $18 Option Price = $0 MILJAN KNEŽEVIĆ, BANJA LUKA - AUGUST 2010
22D – 1 18D Setting Up a Riskless Portfolio • Consider the Portfolio: long D shares short 1 call option • Portfolio is riskless when 22D – 1 = 18D or D = 0.25 MILJAN KNEŽEVIĆ, BANJA LUKA - AUGUST 2010
Valuing the Portfolio(Risk-Free Rate is 12%) • The riskless portfolio is: long 0.25 shares short 1 call option • The value of the portfolio in 3 months is 22 ´ 0.25 – 1 = 4.50 • The value of the portfolio today is 4.5e – 0.12´0.25 = 4.3670 MILJAN KNEŽEVIĆ, BANJA LUKA - AUGUST 2010
Valuing the Option • The portfolio that is long 0.25 shares short 1 option is worth 4.367 • The value of the shares is 5.000 (= 0.25 ´ 20 ) • The value of the option is therefore 0.633 (= 5.000 – 4.367 ) MILJAN KNEŽEVIĆ, BANJA LUKA - AUGUST 2010
Generalization A derivative lasts for time T and is dependent on a stock S(1+a)=Su ƒu S ƒ S(1-a)=Sd ƒd MILJAN KNEŽEVIĆ, BANJA LUKA - AUGUST 2010
Generalization(continued) • Consider the portfolio that is long D shares and short 1 derivative • The portfolio is riskless when SuD– ƒu= SdD – ƒd or SuD – ƒu SdD – ƒd MILJAN KNEŽEVIĆ, BANJA LUKA - AUGUST 2010
Generalization(continued) • Value of the portfolio at time Tis SuD – ƒu • Value of the portfolio today is (SuD – ƒu )e–rT • Another expression for the portfolio value today is SD – f • Hence ƒ = SD – (SuD – ƒu)e–rT MILJAN KNEŽEVIĆ, BANJA LUKA - AUGUST 2010
Generalization(continued) • Substituting for D we obtain ƒ = [ pƒu + (1 – p )ƒd ]e–rT where MILJAN KNEŽEVIĆ, BANJA LUKA - AUGUST 2010
Risk-Neutral Valuation ƒ = [ p ƒu + (1 – p )ƒd ]e-rT The variables p and (1– p ) can be interpreted as the risk-neutral probabilities of up and down movements The value of a derivative is its expected payoff in a risk-neutral world discounted at the risk-free rate Su ƒu S ƒ Sd ƒd p (1– p ) MILJAN KNEŽEVIĆ, BANJA LUKA - AUGUST 2010
Original Example Revisited Su = 22 ƒu = 1 • Since p is a risk-neutral probability 20e0.12 ´0.25 = 22p + 18(1 – p ); p = 0.6523 p S ƒ Sd = 18 ƒd = 0 (1– p ) MILJAN KNEŽEVIĆ, BANJA LUKA - AUGUST 2010
Su = 22 ƒu = 1 0.6523 S ƒ Sd = 18 ƒd = 0 0.3477 Valuing the Option The value of the option is e–0.12´0.25 [0.6523´1 + 0.3477´0] = 0.633 MILJAN KNEŽEVIĆ, BANJA LUKA - AUGUST 2010
Estimating p One way of matching the volatility is to set where s is the volatility andDt is the length of the time step. This is the approach used by Cox, Ross, and Rubinstein MILJAN KNEŽEVIĆ, BANJA LUKA - AUGUST 2010
24.2 22 19.8 20 18 16.2 A Two-Step Example • Each time step is 3 months • K=21, r=12% MILJAN KNEŽEVIĆ, BANJA LUKA - AUGUST 2010
Valuing a Call Option 24.2 3.2 D • Value at node B = e–0.12´0.25(0.6523´3.2 + 0.3477´0) = 2.0257 • Value at node A = e–0.12´0.25(0.6523´2.0257 + 0.3477´0) = 1.2823 22 B 19.8 0.0 20 1.2823 2.0257 A E 18 C 0.0 16.2 0.0 F MILJAN KNEŽEVIĆ, BANJA LUKA - AUGUST 2010
72 0 D 60 B 48 4 50 4.1923 1.4147 A E 40 C 9.4636 32 20 F A Put Option Example; K=52 K = 52, Dt = 1yr r = 5% MILJAN KNEŽEVIĆ, BANJA LUKA - AUGUST 2010
Behaviorof Stock Prices MILJAN KNEŽEVIĆ, BANJA LUKA - AUGUST 2010
Categorization of Stochastic Processes • Discrete time; discrete variable • Discrete time; continuous variable • Continuous time; discrete variable • Continuous time; continuous variable MILJAN KNEŽEVIĆ, BANJA LUKA - AUGUST 2010
Modeling Stock Prices • We can use any of the four types of stochastic processes to model stock prices • The continuous time, continuous variable process proves to be the most useful for the purposes of valuing derivative securities MILJAN KNEŽEVIĆ, BANJA LUKA - AUGUST 2010
Markov Processes • In a Markov process future movements in a variable depend only on where we are, not the history of how we got where we are • We will assume that stock prices follow Markov processes MILJAN KNEŽEVIĆ, BANJA LUKA - AUGUST 2010
Weak-Form Market Efficiency • The assertion is that it is impossible to produce consistently superior returns with a trading rule based on the past history of stock prices. In other words technical analysis does not work. • A Markov process for stock prices is clearly consistent with weak-form market efficiency MILJAN KNEŽEVIĆ, BANJA LUKA - AUGUST 2010
Example of a Discrete Time Continuous Variable Model • A stock price is currently at $40 • At the end of 1 year it is considered that it will have a probability distribution of(40,10) where f(m,s) is a normal distributionwith mean m and standard deviation s. MILJAN KNEŽEVIĆ, BANJA LUKA - AUGUST 2010
Questions • What is the probability distribution of the stock price at the end of 2 years? • ½ years? • ¼ years? • Dt years? Taking limits we have defined a continuous variable, continuous time process MILJAN KNEŽEVIĆ, BANJA LUKA - AUGUST 2010