Download
1 / 9
90 likes | 261 Views
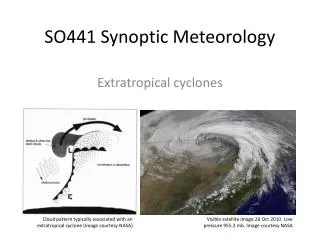
SO441 Synoptic Meteorology. Manual analysis: surface, upper-air charts & identifying features. Why manual analysis?. Tremendous amount of weather data available today when compared to 1950s (1950s are considered the start of modern meteorology)

E N D
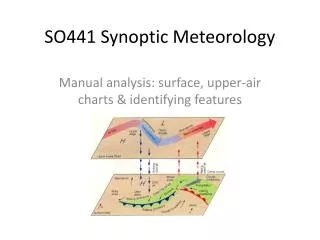
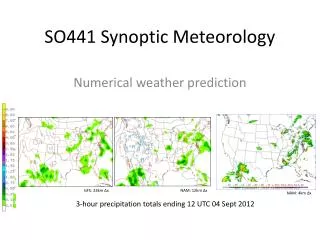
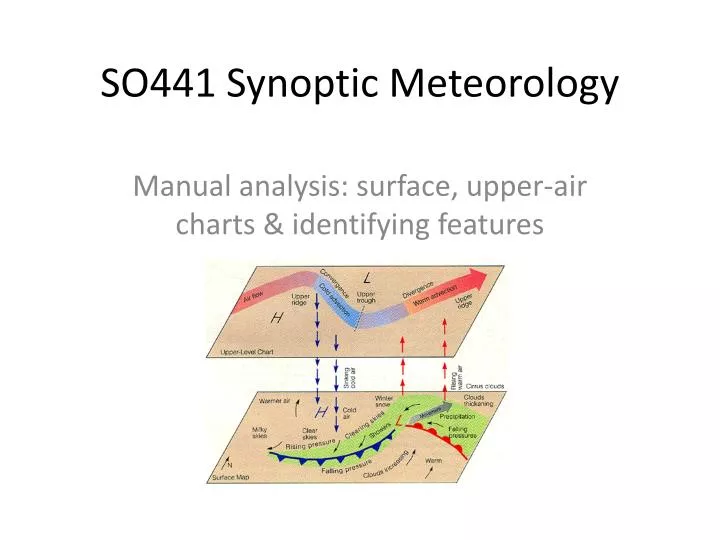
SO441 Synoptic Meteorology Manual analysis: surface, upper-air charts & identifying features
Why manual analysis? • Tremendous amount of weather data available today when compared to 1950s (1950s are considered the start of modern meteorology) • Automated techniques are pretty good at plotting isolines of anything • Temperature, pressure, dew point, precipitation, height, etc. • But … to understand & synthesize the data in the charts requires the meteorologist to examine the actual observations (and it requires patience) • A manual analysis requires a meteorologist to look at every data point! • Time consuming, yes. So is it valuable? • Tremendous benefit in being forced to think about observational data and interpret weather observations
Manual surface analysis • Isopleth: a line along which the value of a quantity is constant, with readings on one side lower and on another side higher • Pressure: • Discontinuities in the pressure field do not existin the atmosphere • Isobars are smooth lines roughly parallel to one another • Regions of light wind should have large spacing between isobars, and regions of strong wind should have small spacing • Temperature: • Tend to be noisier than pressure b/c of elevation and local effects (proximity to water, urban areas, etc.) • Purpose is to analyze synoptic scale variability • Thus a clear outlier in temperature (i.e., maybe a station on top of a mountain) need not be explicitly contoured
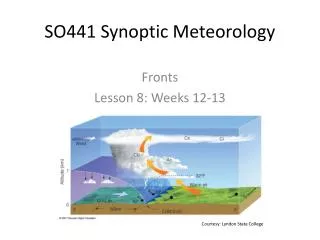
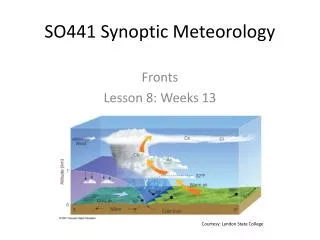
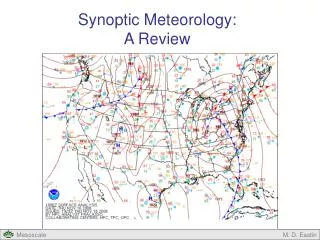
Manual analysis: fronts • What is a front? • Boundary between air masses of different densities • Warm, cold, and stationary fronts found at the edge of strong temperature differences • They mark the boundary of air masses, and often are accompanied by a pronounced wind shift • Fronts are often also associated with a pressure trough • That is, a bending (or “kinking”) of the isobars often aligns along the front • Fronts should be analyzed using more than one variable. • I.e., do not rely only on temperature to locate a front, but instead use temperature, pressure, and wind • Description of fronts from HPC: http://www.hpc.ncep.noaa.gov/html/fntcodes2.shtml http://www.hpc.ncep.noaa.gov/html/sfc2.shtml
Surface station plotand current weather Commonly reported current weather Sample station plot (in degrees F) Available at: http://www.hpc.ncep.noaa.gov/html/stationplot.shtml
More surface analyses • NOAA Ocean Prediction Center “Unified Analysis”: http://www.opc.ncep.noaa.gov/index.shtml • Chilean Weather Service: http://www.meteochile.gob.cl/carta_sinoptica.html
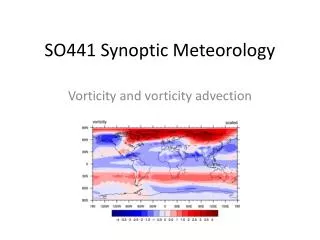
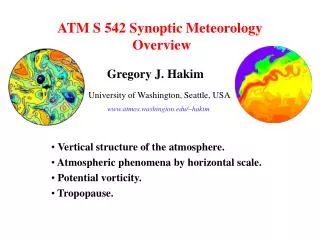
Manual analysis: upper-air • Important to also examine weather observations above the surface of the earth • Typically examine constant-pressure charts • 250 mb, 500 mb, 700 mb, and 850 mb • Height contours almost always parallel to winds (i.e., geostrophic balance) • Temperature gradients tend to not be as sharp above 700 mb • Example: at the surface in winter, Florida can have temps near 30C (mid-80s F) and New York near -10C (mid-10s F), while at 500 mb, temps near -10C over FL may only decrease to -20C over NY.
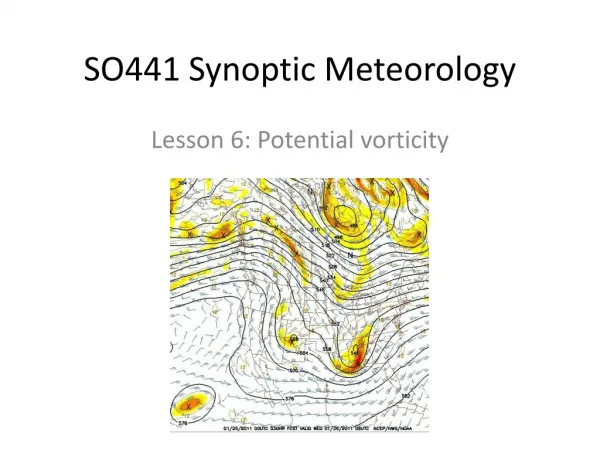
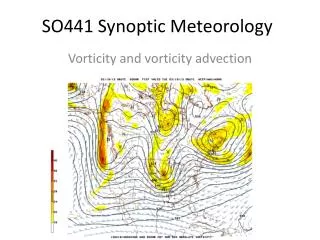
Basics: upper-level analysis • Identifying troughs and ridges • Today’s 500 mb chart: • Where are troughs and ridges?
Upper-air analysis • 250 mb: Contour every 60 m • Be sure to include 10800 m – so 10860, 10920, 10740, etc. • 500 mb: Also contour every 60 m • Be sure to include 5400 m – so 5460, 5520, 5340, etc. • 700 mb: Contour every 30 m • Be sure to include 3000 m – so 3030, 3060, 2970, etc. • 850 mb: Also contour every 30 m • Be sure to include 1500 m – so 1530, 1560, 1470, etc.