Download
1 / 49
490 likes | 616 Views
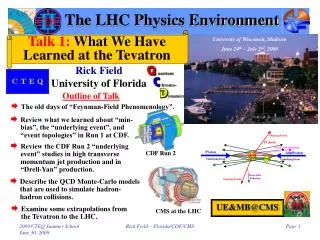
The LHC Physics Environment. Talk 1: What We Have Learned at the Tevatron. University of Wisconsin, Madison June 24 th – July 2 nd , 2009. Rick Field University of Florida. Outline of Talk. The old days of “Feynman-Field Phenomenology”.

E N D
The LHC Physics Environment Talk 1: What We Have Learned at the Tevatron University of Wisconsin, Madison June 24th – July 2nd, 2009 Rick Field University of Florida Outline of Talk • The old days of “Feynman-Field Phenomenology”. • Review what we learned about “min-bias”, the “underlying event”, and “event topologies” in Run 1 at CDF. • Review the CDF Run 2 “underlying event” studies in high transverse momentum jet production and in “Drell-Yan” production. CDF Run 2 • Describe the QCD Monte-Carlo models that are used to simulate hadron-hadron collisions. UE&MB@CMS • Examine some extrapolations from the Tevatron to the LHC. CMS at the LHC Rick Field – Florida/CDF/CMS
Feynman-Field Phenomenology Toward and Understanding of Hadron-Hadron Collisions 1st hat! Feynman and Field • From 7 GeV/c p0’s to 600 GeV/c Jets. The early days of trying to understand and simulate hadron-hadron collisions. Caltech 1973 Rick Field – Florida/CDF/CMS
Hadron-Hadron Collisions FF1 1977 • What happens when two hadrons collide at high energy? Feynman quote from FF1 “The model we shall choose is not a popular one, so that we will not duplicate too much of the work of others who are similarly analyzing various models (e.g. constituent interchange model, multiperipheral models, etc.). We shall assume that the high PT particles arise from direct hard collisions between constituent quarks in the incoming particles, which fragment or cascade down into several hadrons.” • Most of the time the hadrons ooze through each other and fall apart (i.e.no hard scattering). The outgoing particles continue in roughly the same direction as initial proton and antiproton. • Occasionally there will be a large transverse momentum meson. Question: Where did it come from? • We assumed it came from quark-quark elastic scattering, but we did not know how to calculate it! “Black-Box Model” Rick Field – Florida/CDF/CMS
Quark-Quark Black-Box Model No gluons! FF1 1977 Quark Distribution Functions determined from deep-inelastic lepton-hadron collisions Feynman quote from FF1 “Because of the incomplete knowledge of our functions some things can be predicted with more certainty than others. Those experimental results that are not well predicted can be “used up” to determine these functions in greater detail to permit better predictions of further experiments. Our papers will be a bit long because we wish to discuss this interplay in detail.” Quark Fragmentation Functions determined from e+e- annihilations Quark-Quark Cross-Section Unknown! Deteremined from hadron-hadron collisions. Rick Field – Florida/CDF/CMS
Quark-Quark Black-Box Model FF1 1977 Predict increase with increasing CM energy W Predict particle ratios When Jim Cronin’s group at the University of Chicago measured these rations and we knew we were on the right track! The “underlying event” (Beam-Beam Remnants)! Predict overall event topology (FFF1 paper 1977) 7 GeV/c p0’s! Rick Field – Florida/CDF/CMS
QCD Approach: Quarks & Gluons FFF2 1978 Quark & Gluon Fragmentation Functions Q2 dependence predicted from QCD Feynman quote from FFF2 “We investigate whether the present experimental behavior of mesons with large transverse momentum in hadron-hadron collisions is consistent with the theory of quantum-chromodynamics (QCD) with asymptotic freedom, at least as the theory is now partially understood.” Parton Distribution Functions Q2 dependence predicted from QCD Quark & Gluon Cross-Sections Calculated from QCD Rick Field – Florida/CDF/CMS
High PT Jets CDF (2006) Feynman, Field, & Fox (1978) Predict large “jet” cross-section 30 GeV/c! Feynman quote from FFF “At the time of this writing, there is still no sharp quantitative test of QCD. An important test will come in connection with the phenomena of high PT discussed here.” 600 GeV/c Jets! Rick Field – Florida/CDF/CMS
“Hard Scattering” Component QCD Monte-Carlo Models:High Transverse Momentum Jets • Start with the perturbative 2-to-2 (or sometimes 2-to-3) parton-parton scattering and add initial and final-state gluon radiation (in the leading log approximation or modified leading log approximation). “Underlying Event” • The “underlying event” consists of the “beam-beam remnants” and from particles arising from soft or semi-soft multiple parton interactions (MPI). The “underlying event” is an unavoidable background to most collider observables and having good understand of it leads to more precise collider measurements! • Of course the outgoing colored partons fragment into hadron “jet” and inevitably “underlying event” observables receive contributions from initial and final-state radiation. Rick Field – Florida/CDF/CMS
“Hard Scattering” Component QCD Monte-Carlo Models:Lepton-Pair Production • Start with the perturbative Drell-Yan muon pair production and add initial-state gluon radiation (in the leading log approximation or modified leading log approximation). “Underlying Event” • The “underlying event” consists of the “beam-beam remnants” and from particles arising from soft or semi-soft multiple parton interactions (MPI). • Of course the outgoing colored partons fragment into hadron “jet” and inevitably “underlying event” observables receive contributions from initial-state radiation. Rick Field – Florida/CDF/CMS
Proton-AntiProton Collisionsat the Tevatron The CDF “Min-Bias” trigger picks up most of the “hard core” cross-section plus a small amount of single & double diffraction. stot = sEL + sIN stot = sEL + sSD+sDD+sHC 1.8 TeV: 78mb = 18mb + 9mb + (4-7)mb + (47-44)mb CDF “Min-Bias” trigger 1 charged particle in forward BBC AND 1 charged particle in backward BBC The “hard core” component contains both “hard” and “soft” collisions. “Inelastic Non-Diffractive Component” Beam-Beam Counters 3.2 < |h| < 5.9 Rick Field – Florida/CDF/CMS
3 charged particles dNchg/dhdf = 3/4p = 0.24 1 charged particle Divide by 4p 1 GeV/c PTsum dNchg/dhdf = 1/4p = 0.08 3 GeV/c PTsum dPTsum/dhdf = 1/4p GeV/c = 0.08 GeV/c dPTsum/dhdf = 3/4p GeV/c = 0.24 GeV/c Particle Densities • Study the charged particles (pT > 0.5 GeV/c, |h| < 1) and form the charged particle density, dNchg/dhdf, and the charged scalar pT sum density, dPTsum/dhdf. Charged Particles pT > 0.5 GeV/c |h| < 1 CDF Run 2 “Min-Bias” DhDf = 4p = 12.6 Rick Field – Florida/CDF/CMS
CDF Run 1 “Min-Bias” DataCharged Particle Density • Shows CDF “Min-Bias” data on the number of charged particles per unit pseudo-rapidity at 630 and 1,800 GeV. There are about 4.2 charged particles per unit h in “Min-Bias” collisions at 1.8 TeV (|h| < 1, all pT). <dNchg/dh> = 4.2 <dNchg/dhdf> = 0.67 • Convert to charged particle density, dNchg/dhdf, by dividing by 2p. There are about 0.67 charged particles per unit h-f in “Min-Bias” collisions at 1.8 TeV (|h| < 1, all pT). 0.25 0.67 • There are about 0.25 charged particles per unit h-f in “Min-Bias” collisions at 1.96 TeV (|h| < 1, pT > 0.5 GeV/c). Rick Field – Florida/CDF/CMS
CDF Run 1 Min-Bias “Associated”Charged Particle Density “Associated” densities do not include PTmax! Highest pT charged particle! • Use the maximum pT charged particle in the event, PTmax, to define a direction and look at the the “associated” density, dNchg/dhdf, in “min-bias” collisions (pT > 0.5 GeV/c, |h| < 1). It is more probable to find a particle accompanying PTmax than it is to find a particle in the central region! • Shows the data on the Df dependence of the “associated” charged particle density, dNchg/dhdf, for charged particles (pT > 0.5 GeV/c, |h| < 1, not including PTmax) relative to PTmax (rotated to 180o) for “min-bias” events. Also shown is the average charged particle density, dNchg/dhdf, for “min-bias” events. Rick Field – Florida/CDF/CMS
CDF Run 1 Min-Bias “Associated”Charged Particle Density Rapid rise in the particle density in the “transverse” region as PTmax increases! PTmax > 2.0 GeV/c Transverse Region Transverse Region Ave Min-Bias 0.25 per unit h-f PTmax > 0.5 GeV/c • Shows the data on the Df dependence of the “associated” charged particle density, dNchg/dhdf, for charged particles (pT > 0.5 GeV/c, |h| < 1, not including PTmax) relative to PTmax (rotated to 180o) for “min-bias” eventswith PTmax > 0.5, 1.0, and 2.0 GeV/c. • Shows “jet structure” in “min-bias” collisions (i.e.the “birth” of the leading two jets!). Rick Field – Florida/CDF/CMS
Min-Bias “Associated”Charged Particle Density • Shows the “associated” charged particle density in the “toward”, “away” and “transverse” regions as a function of PTmax for charged particles (pT > 0.5 GeV/c, |h| < 1, not including PTmax) for “min-bias” events at 1.96 TeVfrom PYTHIA Tune A (generator level). “Toward” Region ~ factor of 2! “Transverse” “Transverse” • Shows the Df dependence of the “associated” charged particle density, dNchg/dhdf, for charged particles (pT > 0.5 GeV/c, |h| < 1, not including PTmax) relative to PTmax (rotated to 180o) for “min-bias” events at 1.96 TeVwith PTmax > 0.5, 1.0, 2.0, 5.0, and 10.0 GeV/c from PYTHIA Tune A (generator level). Rick Field – Florida/CDF/CMS
“Transverse” Charged Density 0.6 • Shows the charged particle density in the “transverse” region for charged particles (pT > 0.5 GeV/c, |h| < 1) at 1.96 TeVas defined by PTmax, PT(chgjet#1), and PT(jet#1) from PYTHIATune Aat the particle level (i.e. generator level). Rick Field – Florida/CDF/CMS
CDF Run 1: Evolution of Charged Jets“Underlying Event” • Look at charged particle correlations in the azimuthal angle Df relative to the leading charged particle jet. • Define |Df| < 60o as “Toward”, 60o < |Df| < 120o as “Transverse”, and |Df| > 120o as “Away”. • All three regions have the same size in h-f space, DhxDf = 2x120o = 4p/3. Charged Particle Df Correlations PT > 0.5 GeV/c |h| < 1 Look at the charged particle density in the “transverse” region! “Transverse” region very sensitive to the “underlying event”! CDF Run 1 Analysis Rick Field – Florida/CDF/CMS
Factor of 2! Run 1 Charged Particle Density“Transverse” pT Distribution • Compares the average “transverse” charge particle density with the average “Min-Bias” charge particle density (|h|<1, pT>0.5 GeV). Shows how the “transverse” charge particle density and the Min-Bias charge particle density is distributed in pT. PT(charged jet#1) > 30 GeV/c “Transverse” <dNchg/dhdf> = 0.56 “Min-Bias” CDF Run 1 Min-Bias data <dNchg/dhdf> = 0.25 Rick Field – Florida/CDF/CMS
ISAJET 7.32“Transverse” Density ISAJET uses a naïve leading-log parton shower-model which does not agree with the data! • Plot shows average “transverse” charge particle density (|h|<1, pT>0.5 GeV) versus PT(charged jet#1) compared to the QCD hard scattering predictions of ISAJET 7.32 (default parameters with PT(hard)>3 GeV/c) . • The predictions of ISAJET are divided into two categories: charged particles that arise from the break-up of the beam and target (beam-beam remnants); and charged particles that arise from the outgoing jet plus initial and final-state radiation(hard scattering component). ISAJET “Hard” Component Beam-Beam Remnants Rick Field – Florida/CDF/CMS
HERWIG 6.4“Transverse” Density • Plot shows average “transverse” charge particle density (|h|<1, pT>0.5 GeV) versus PT(charged jet#1) compared to the QCD hard scattering predictions of HERWIG 5.9(default parameters with PT(hard)>3 GeV/c). • The predictions of HERWIG are divided into two categories: charged particles that arise from the break-up of the beam and target (beam-beam remnants); and charged particles that arise from the outgoing jet plus initial and final-state radiation(hard scattering component). HERWIG uses a modified leading-log parton shower-model which does agrees better with the data! HERWIG “Hard” Component Beam-Beam Remnants Rick Field – Florida/CDF/CMS
HERWIG 6.4“Transverse” PT Distribution • Compares the average “transverse” charge particle density (|h|<1, pT>0.5 GeV) versus PT(charged jet#1) and the pT distribution of the “transverse” density, dNchg/dhdfdPT with the QCD hard scattering predictions of HERWIG 6.4(default parameters with PT(hard)>3 GeV/c. Shows how the “transverse” charge particle density is distributed in pT. HERWIG has the too steep of a pT dependence of the “beam-beam remnant” component of the “underlying event”! Herwig PT(chgjet#1) > 30 GeV/c “Transverse” <dNchg/dhdf> = 0.51 Herwig PT(chgjet#1) > 5 GeV/c <dNchg/dhdf> = 0.40 Rick Field – Florida/CDF/CMS
MPI: Multiple PartonInteractions • PYTHIA models the “soft” component of the underlying event with color string fragmentation, but in addition includes a contribution arising from multiple parton interactions (MPI) in which one interaction is hard and the other is “semi-hard”. • The probability that a hard scattering events also contains a semi-hard multiple parton interaction can be varied but adjusting the cut-off for the MPI. • One can also adjust whether the probability of a MPI depends on the PT of the hard scattering, PT(hard) (constant cross section or varying with impact parameter). • One can adjust the color connections and flavor of the MPI (singlet or nearest neighbor, q-qbar or glue-glue). • Also, one can adjust how the probability of a MPI depends on PT(hard) (single or double Gaussian matter distribution). Rick Field – Florida/CDF/CMS
Proton Proton AntiProton AntiProton MPI, Pile-Up, and Overlap MPI: Multiple Parton Interactions • MPI: Additional 2-to-2 parton-parton scatterings within a single proton-antiproton collision. Pile-Up Interaction Region Dz • Pile-Up: More than one proton-antiproton collision in the beam crossing. Overlap • Overlap: An experimental timing issue where a proton-antiproton collision from the next beam crossing gets included in the proton-antiproton collision from the current beam crossing because the next crossing happened before the event could be read out. Rick Field – Florida/CDF/CMS
Tuning PYTHIA:Multiple Parton Interaction Parameters I will talk more about the energy dependence of MPI tomorrow morning! Hard Core Determines the energy dependence of the MPI! Determine by comparing with 630 GeV data! Affects the amount of initial-state radiation! Take E0 = 1.8 TeV Reference point at 1.8 TeV Rick Field – Florida/CDF/CMS
PYTHIA 6.206 Defaults MPI constant probability scattering • Plot shows the “Transverse” charged particle density versus PT(chgjet#1) compared to the QCD hard scattering predictions of PYTHIA 6.206 (PT(hard) > 0) using the default parameters for multiple parton interactions and CTEQ3L, CTEQ4L, and CTEQ5L. PYTHIA default parameters Default parameters give very poor description of the “underlying event”! Note Change PARP(67) = 4.0 (< 6.138) PARP(67) = 1.0 (> 6.138) Rick Field – Florida/CDF/CMS
Run 1 PYTHIA Tune A CDF Default! • Plot shows the “transverse” charged particle density versus PT(chgjet#1) compared to the QCD hard scattering predictions of two tuned versions of PYTHIA 6.206 (CTEQ5L, Set B (PARP(67)=1)andSet A(PARP(67)=4)). PYTHIA 6.206 CTEQ5L Run 1 Analysis Not the default! Old PYTHIA default (more initial-state radiation) Old PYTHIA default (more initial-state radiation) New PYTHIA default (less initial-state radiation) New PYTHIA default (less initial-state radiation) Rick Field – Florida/CDF/CMS
PYTHIA Tune A Min-Bias“Soft” + ”Hard” Tuned to fit the CDF Run 1 “underlying event”! PYTHIA Tune A CDF Run 2 Default 12% of “Min-Bias” events have PT(hard) > 5 GeV/c! 1% of “Min-Bias” events have PT(hard) > 10 GeV/c! • PYTHIA regulates the perturbative 2-to-2 parton-parton cross sections with cut-off parameters which allows one to run with PT(hard) > 0. One can simulate both “hard” and “soft” collisions in one program. Lots of “hard” scattering in “Min-Bias” at the Tevatron! • The relative amount of “hard” versus “soft” depends on the cut-off and can be tuned. • This PYTHIA fit predicts that 12% of all “Min-Bias” events are a result of a hard 2-to-2 parton-parton scattering with PT(hard) > 5 GeV/c (1% with PT(hard) > 10 GeV/c)! Rick Field – Florida/CDF/CMS
PYTHIA Tune ALHC Min-Bias Predictions 12% of “Min-Bias” events have PT(hard) > 10 GeV/c! LHC? • Shows the center-of-mass energy dependence of the charged particle density, dNchg/dhdfdPT, for “Min-Bias” collisions compared with PYTHIA Tune A with PT(hard) > 0. 1% of “Min-Bias” events have PT(hard) > 10 GeV/c! • PYTHIA Tune A predicts that 1% of all “Min-Bias” events at 1.8 TeV are a result of a hard 2-to-2 parton-parton scattering with PT(hard) > 10 GeV/c which increases to 12% at 14 TeV! Rick Field – Florida/CDF/CMS
“Towards”, “Away”, “Transverse” Look at the charged particle density, the charged PTsum density and the ETsum density in all 3 regions! • Look at correlations in the azimuthal angle Df relative to the leading charged particle jet (|h| < 1) or the leading calorimeter jet (|h| < 2). • Define |Df| < 60o as “Toward”, 60o < |Df| < 120o as “Transverse ”, and |Df| > 120o as “Away”. Each of the three regions have area DhDf = 2×120o = 4p/3. Df Correlations relative to the leading jet Charged particles pT > 0.5 GeV/c |h| < 1 Calorimeter towers ET > 0.1 GeV |h| < 1 “Transverse” region is very sensitive to the “underlying event”! Z-Boson Direction Rick Field – Florida/CDF/CMS
Event Topologies • “Leading Jet” events correspond to the leading calorimeter jet (MidPoint R = 0.7) in the region |h| < 2 with no other conditions. “Leading Jet” subset • “Inclusive 2-Jet Back-to-Back” events are selected to have at least two jets with Jet#1 and Jet#2 nearly “back-to-back” (Df12 > 150o) with almost equal transverse energies (PT(jet#2)/PT(jet#1) > 0.8) with no other conditions . “Inc2J Back-to-Back” subset “Exc2J Back-to-Back” • “Exclusive 2-Jet Back-to-Back” events are selected to have at least two jets with Jet#1 and Jet#2 nearly “back-to-back” (Df12 > 150o) with almost equal transverse energies (PT(jet#2)/PT(jet#1) > 0.8) and PT(jet#3) < 15 GeV/c. “Charged Jet” • “Leading ChgJet” events correspond to the leading charged particle jet (R = 0.7) in the region |h| < 1 with no other conditions. • “Z-Boson” events are Drell-Yan events with 70 < M(lepton-pair) < 110 GeV with no other conditions. Z-Boson Rick Field – Florida/CDF/CMS
“transMAX” & “transMIN” • Define the MAX and MIN “transverse” regions (“transMAX” and “transMIN”) on an event-by-event basis with MAX (MIN) having the largest (smallest) density. Each of the two “transverse” regions have an area in h-f space of 4p/6. “transMIN” very sensitive to the “beam-beam remnants”! Z-Boson Direction Area = 4p/6 • The “transMIN” region is very sensitive to the “beam-beam remnant” and the soft multiple parton interaction components of the “underlying event”. • The difference, “transDIF” (“transMAX” minus “transMIN”), is very sensitive to the “hard scattering” component of the “underlying event” (i.e. hard initial and final-state radiation). • The overall “transverse” density is the average of the “transMAX” and “transMIN” densities. Rick Field – Florida/CDF/CMS
Observables at theParticle and Detector Level “Leading Jet” “Back-to-Back” Rick Field – Florida/CDF/CMS
CDF Run 1 PT(Z) Tune used by the CDF-EWK group! PYTHIA 6.2 CTEQ5L • Shows the Run 1 Z-boson pT distribution (<pT(Z)> ≈ 11.5 GeV/c) compared with PYTHIA Tune A (<pT(Z)> = 9.7 GeV/c), and PYTHIA Tune AW (<pT(Z)> = 11.7 GeV/c). UE Parameters ISR Parameters Effective Q cut-off, below which space-like showers are not evolved. Intrensic KT The Q2 = kT2 in as for space-like showers is scaled by PARP(64)! Rick Field – Florida/CDF/CMS
Df Jet#1-Jet#2 Jet#1-Jet#2 Df Distribution Jet-Jet Correlations (DØ) • MidPoint Cone Algorithm (R = 0.7, fmerge = 0.5) • L= 150 pb-1 (Phys. Rev. Lett. 94 221801 (2005)) • Data/NLO agreement good. Data/HERWIG agreement good. • Data/PYTHIA agreement good provided PARP(67) = 1.0→4.0 (i.e. like Tune A, best fit 2.5). Rick Field – Florida/CDF/CMS
CDF Run 1 PT(Z) PYTHIA 6.2 CTEQ5L • Shows the Run 1 Z-boson pT distribution (<pT(Z)> ≈ 11.5 GeV/c) compared with PYTHIA Tune DW, and HERWIG. UE Parameters ISR Parameters Tune DW uses D0’s perfered value of PARP(67)! Intrensic KT Tune DW has a lower value of PARP(67) and slightly more MPI! Rick Field – Florida/CDF/CMS
PYTHIA 6.2 Tunes All use LO as with L = 192 MeV! UE Parameters Uses CTEQ6L Tune A energy dependence! (not the default) ISR Parameter Intrinsic KT Rick Field – Florida/CDF/CMS
PYTHIA 6.2 Tunes These are “old” PYTHIA 6.2 tunes! There are new 6.420 tunes by Peter Skands (Tune S320, update of S0) Peter Skands (Tune N324, N0CR) Hendrik Hoeth (Tune P329, “Professor”) All use LO as with L = 192 MeV! UE Parameters Tune B Tune AW Tune A ATLAS energy dependence! (PYTHIA default) Tune BW ISR Parameter Tune DW Tune D6 Tune D Tune D6T Intrinsic KT Rick Field – Florida/CDF/CMS
JIMMY at CDF JIMMY was tuned to fit the energy density in the “transverse” region for “leading jet” events! JIMMY Runs with HERWIG and adds multiple parton interactions! PT(JIM)= 2.5 GeV/c. The Drell-Yan JIMMY Tune PTJIM = 3.6 GeV/c, JMRAD(73) = 1.8 JMRAD(91) = 1.8 The Energy in the “Underlying Event” in High PT Jet Production JIMMY: MPI J. M. Butterworth J. R. Forshaw M. H. Seymour PT(JIM)= 3.25 GeV/c. “Transverse” <Densities> vs PT(jet#1) Rick Field – Florida/CDF/CMS
“Towards”, “Away”, “Transverse” • Data at 1.96 TeV on the density of charged particles, dN/dhdf, with pT > 0.5 GeV/c and |h| < 1 for “leading jet” events as a function of the leading jet pT for the “toward”, “away”, and “transverse” regions. The data are corrected to the particle level (with errors that include both the statistical error and the systematic uncertainty) and are compared with PYTHIA Tune A at the particle level (i.e. generator level). “Leading Jet” Factor of ~13 Factor of ~16 Factor of ~4.5 • Data at 1.96 TeV on the charged particle scalar pT sum density, dPT/dhdf, with pT > 0.5 GeV/c and |h| < 1 for “leading jet” events as a function of the leading jet pT for the “toward”, “away”, and “transverse” regions. The data are corrected to the particle level (with errors that include both the statistical error and the systematic uncertainty) and are compared with PYTHIA Tune A at the particle level (i.e. generator level). • Data at 1.96 TeV on the particle scalar ET sum density, dET/dhdf, for |h| < 1 for “leading jet” events as a function of the leading jet pT for the “toward”, “away”, and “transverse” regions. The data are corrected to the particle level (with errors that include both the statistical error and the systematic uncertainty) and are compared with PYTHIA Tune A at the particle level (i.e. generator level). Rick Field – Florida/CDF/CMS
Charged Particle Density HERWIG + JIMMY Tune (PTJIM = 3.6) H. Hoeth, MPI@LHC08 • Data at 1.96 TeV on the density of charged particles, dN/dhdf, with pT > 0.5 GeV/c and |h| < 1 for “Z-Boson” and “Leading Jet” events as a function of the leading jet pT or PT(Z) for the “toward”, “away”, and “transverse” regions. The data are corrected to the particle level (with errors that include both the statistical error and the systematic uncertainty) and are compared with PYTHIA Tune AW and Tune A, respectively, at the particle level (i.e. generator level). Rick Field – Florida/CDF/CMS
Charged PTsum Density • Data at 1.96 TeV on the charged scalar PTsum density, dPT/dhdf, with pT > 0.5 GeV/c and |h| < 1 for “Z-Boson” and “Leading Jet” events as a function of the leading jet pT or PT(Z) for the “toward”, “away”, and “transverse” regions. The data are corrected to the particle level (with errors that include both the statistical error and the systematic uncertainty) and are compared with PYTHIA Tune AW and Tune A, respectively, at the particle level (i.e. generator level). Rick Field – Florida/CDF/CMS
The “TransMAX/MIN” Regions • Data at 1.96 TeV on the charged particle density, dN/dhdf, with pT > 0.5 GeV/c and |h| < 1 for “Z-Boson” and “Leading Jet” events as a function of PT(Z) or the leading jet pT for the “transMAX”, and “transMIN” regions. The data are corrected to the particle level (with errors that include both the statistical error and the systematic uncertainty) and are compared with PYTHIA Tune AW and Tune A, respectively, at the particle level (i.e. generator level). • Data at 1.96 TeV on the density of charged particles, dN/dhdf, with pT > 0.5 GeV/c and |h| < 1 for “leading jet” events as a function of the leading jet pT and for Z-Boson events as a function of PT(Z) for “TransDIF” =“transMAX” minus “transMIN” regions. The data are corrected to the particle level (with errors that include both the statistical error and the systematic uncertainty) and are compared with PYTHIA Tune A and HERWIG (without MPI) at the particle level (i.e. generator level). Rick Field – Florida/CDF/CMS
Charged Particle <pT> H. Hoeth, MPI@LHC08 • Data at 1.96 TeV on the charged particle average pT, with pT > 0.5 GeV/c and |h| < 1 for the “toward” region for “Z-Boson” and the “transverse” region for “Leading Jet” events as a function of the leading jet pT or PT(Z). The data are corrected to the particle level (with errors that include both the statistical error and the systematic uncertainty) and are compared with PYTHIA Tune AW and Tune A, respectively, at the particle level (i.e. generator level). The Z-Boson data are also compared with PYTHIA Tune DW, the ATLAS tune, and HERWIG (without MPI) Rick Field – Florida/CDF/CMS
Z-Boson: “Towards”, Transverse”, & “TransMIN” Charge Density H. Hoeth, MPI@LHC08 • Data at 1.96 TeV on the density of charged particles, dN/dhdf, with pT > 0.5 GeV/c and |h| < 1 for “Z-Boson” events as a function of PT(Z) for the “toward” and “transverse” regions. The data are corrected to the particle level (with errors that include both the statistical error and the systematic uncertainty) and are compared with PYTHIA Tune AW and HERWIG (without MPI) at the particle level (i.e. generator level). Rick Field – Florida/CDF/CMS
Z-Boson: “Towards” Region • Data at 1.96 TeV on the density of charged particles, dN/dhdf, with pT > 0.5 GeV/c and |h| < 1 for “Z-Boson” events as a function of PT(Z) for the “toward” region. The data are corrected to the particle level (with errors that include both the statistical error and the systematic uncertainty) and are compared with PYTHIA Tune AW, Tune DW, PYTHIA ATLAS Tune, HERWIG (without MPI), and HERWIG (with JIMMY MPI) at the particle level (i.e. generator level). ≈2.6 ≈2.1 HERWIG (without MPI) small change! Tevatron LHC Rick Field – Florida/CDF/CMS
Z-Boson: “Towards” Region • Data at 1.96 TeV on the the average pT of charged particles with pT > 0.5 GeV/c and |h| < 1 for “Z-Boson” events as a function of PT(Z) for the “toward” region. The data are corrected to the particle level (with errors that include both the statistical error and the systematic uncertainty) and are compared with PYTHIA Tune AW, Tune DW, PYTHIA ATLAS Tune, HERWIG (without MPI), and HERWIG (with JIMMY MPI) at the particle level (i.e. generator level). Tevatron LHC Rick Field – Florida/CDF/CMS
Drell-Yan Production Tevatron vs LHC • Average Lepton-Pair transverse momentum at the Tevatron and the LHC for PYTHIA Tune DW and HERWIG (without MPI). Lepton-Pair Transverse Momentum <pT(m+m-)> is much larger at the LHC! Shapes of the pT(m+m-) distribution at the Z-boson mass. Z • Shape of the Lepton-Pair pT distribution at the Z-boson mass at the Tevatron and the LHC for PYTHIA Tune DW and HERWIG (without MPI). Rick Field – Florida/CDF/CMS
Leading Jet: “Transverse” Region • Data at 1.96 TeV on the density of charged particles, dN/dhdf, with pT > 0.5 GeV/c and |h| < 1 for “Leading Jet” events as a function of PT(jet#1) for the “transverse” region. The data are corrected to the particle level (with errors that include both the statistical error and the systematic uncertainty) and are compared with PYTHIA Tune A, and HERWIG (without MPI) at the particle level (i.e. generator level). ≈2.2 ≈1.8 Tevatron LHC Rick Field – Florida/CDF/CMS
The LHC Physics Environment Talk 2: Extrapolations from the Tevatron to RHIC and the LHC University of Wisconsin, Madison June 24th – July 2nd, 2009 Rick Field University of Florida Outline of Talk • The Pythia MPI energy scaling parameter PARP(90). • The “underlying event” at STAR. Extrapolations to RHIC. • LHC predictions for the “underlying event” (hard scattering QCD & Drell-Yan). CDF Run 2 • “Min-bias” and “pile-up” at the LHC. • Correlations: charged particle <pT> versus the charged multiplicity in “min-bias” and Drell-Yan. • Summary & Conclusions. UE&MB@CMS CMS at the LHC • Early LHC Thesis Projects. Rick Field – Florida/CDF/CMS