Download
1 / 12
120 likes | 167 Views
Explore z-scores, Chebyshev’s Theorem, Empirical Rule, and Outliers in statistical analysis with practical examples and calculations. Learn how to interpret data distributions and identify outliers in a dataset.

E N D
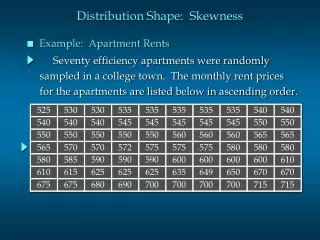
Distribution Shape: Skewness • Example: Apartment Rents Seventy efficiency apartments were randomly sampled in a college town. The monthly rent prices for the apartments are listed below in ascending order. 525 530 530 535 535 535 535 535 540 540 540 540 540 545 545 545 545 545 550 550 550 550 550 550 550 560 560 560 565 565 565 570 570 572 575 575 575 580 580 580 580 585 590 590 590 600 600 600 600 610 610 615 625 625 625 635 649 650 670 670 675 675 680 690 700 700 700 700 715 715
z-Scores The z-score is often called the standardized value. It denotes the number of standard deviations a data value xi is from the mean. Excel’s STANDARDIZE function can be used to compute the z-score.
z-Scores • An observation’s z-score is a measure of the relative location of the observation in a data set. • A data value less than the sample mean will have a • z-score less than zero. • A data value greater than the sample mean will have • a z-score greater than zero. • A data value equal to the sample mean will have a • z-score of zero.
Chebyshev’s Theorem At least (1 - 1/z2) of the items in any data set will be within z standard deviations of the mean, where z is any value greater than 1. Chebyshev’s theorem requires z > 1, but z need not be an integer.
Chebyshev’s Theorem At least of the data values must be within of the mean. 75% z = 2 standard deviations At least of the data values must be within of the mean. 89% z = 3 standard deviations At least of the data values must be within of the mean. 94% z = 4 standard deviations
Empirical Rule When the data are believed to approximate a bell-shaped distribution … The empirical rule can be used to determine the percentage of data values that must be within a specified number of standard deviations of the mean. The empirical rule is based on the normal distribution, which is covered in Chapter 6.
Empirical Rule For data having a bell-shaped distribution: of the values of a normal random variable are within of its mean. 68.26% +/- 1 standard deviation of the values of a normal random variable are within of its mean. 95.44% +/- 2 standard deviations of the values of a normal random variable are within of its mean. 99.72% +/- 3 standard deviations
99.72% 95.44% 68.26% Empirical Rule x m m + 3s m – 3s m – 1s m + 1s m – 2s m + 2s
Detecting Outliers • An outlier is an unusually small or unusually large • value in a data set. • A data value with a z-score less than -3 or greater • than +3 might be considered an outlier. • It might be: • an incorrectly recorded data value • a data value that was incorrectly included in the • data set • a correctly recorded data value that belongs in • the data set
A survey of local companies found that the mean amount of travel allowances for executives was 0.25 USD per mile. The standard deviation was 0.02 USD. Using Chebyshev`s Theorem find the minimum percentage of the data values that will fall between 0.20 USD and 0.30 USD.
Problem Based on a survey of dental practitioners, the study reported that the mean number of units of local anesthetics used per week by dentists was 79, with a standard deviation of 23. Suppose we want to determine the percentage of dentists who use less than 102 units of local anesthetics per week. a- Assuming nothing is known about the shape of the distribution for the data, what percentage of dentists use less than 102 units of local anesthetics per week? b- Assuming that the data has a mound-shaped (bell-shaped or symmetric) distribution, what percentage of dentists use less than 102 units of local anesthetics per week?
Problem Based on the study to compare the effectiveness of washing the hands with soap and rubbing the hands with alcohol-based antiseptics. Table: Descriptive statistics on bacteria counts for the two groups of health care workers. a- For hand rubbers, form an interval that contains at least 75% of the bacterial counts. b- For hand washers, form an interval that contains at least 75% of the bacterial counts. (Note that the bacterial count cannot be less than 0) c- On the basis of your results in parts a and b, make an inference about the effectiveness of the two hand cleaning methods.