Download
1 / 50
500 likes | 658 Views
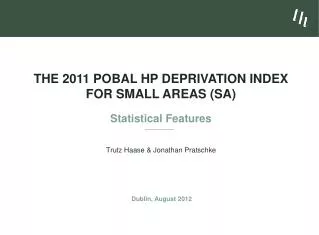
Stormont, 13 th November 20 13. The Pobal HP Deprivation Index An Inter-temporal and Multi-jurisdictional Analysis. The 2011 Pobal HP Deprivation Index. The purpose of the presentation is to provide an overview of the conceptual components which underlie the HP Deprivation Index

E N D
Stormont, 13th November 2013 The Pobal HP Deprivation IndexAn Inter-temporal and Multi-jurisdictional Analysis
The 2011 Pobal HP Deprivation Index The purpose of the presentation is to provide an overview of the conceptual components which underlie the HP Deprivation Index to discuss the treatment of rural deprivation to provide a practical demonstration of the HP Index to draw out the Index’ advantages when modelling the social gradient of health outcomes and developing resource allocation models
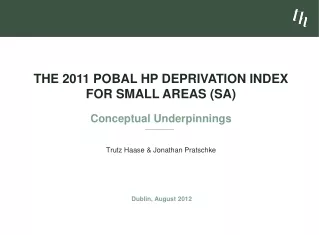
Conceptual Underpinnings of the • Pobal HP Deprivation Index
A Comprehensive Definition of Poverty • Relative Poverty “People are living in poverty if their income and resources (material, cultural and social) are so inadequate as to preclude them from having a standard of living which is regarded as acceptable by Irish society generally.” (Government of Ireland, NAPS, 1997) • Relative Deprivation “The fundamental implication of the term deprivation is of an absence – of essential or desirable attributes, possessions and opportunities which are considered no more than the minimum by that society.” (Coombes et al., DoE – UK, 1995)
Traditional Approach: Exploratory Factor Analysis (EFA) • Ordinary Factor Analysis (EFA) reduces variables to a smaller number of underlying Dimensions or Factors V1 F1 V2 V3 V4 V5 F2 V6 • EFA is essentially an exploratory technique; .i.e. data-driven • all variables load on all factors • the structure matrix is the (accidental) outcome of the variables available • EFA cannot be used to compare outcomes over time
New Approach: Confirmatory Factor Analysis (CFA) • Confirmatory Factor Analysis also reduces observations to the underlying Factors, however d V1 1 L1 d V2 2 d V3 3 d V4 4 d V5 L2 5 d V6 6 • CFA requires a strong theoretical justification before the model is specified • the researcher decides which of the observed variables are to be associated with which of the latent constructs • variables are conceptualised as the imperfect manifestations of the latent concepts • CFA model allows the comparison of outcomes over time • CFA facilitates the objective evaluation of the quality of the model through fit statistics
The Underlying Dimensions of Social Disadvantage • Demographic Decline(predominantly rural) • population loss and the social and demographic effects of emigration (age dependency, low education of adult population) • Social Class Deprivation(applying in rural and urban areas) • social class composition, education, housing quality • Labour Market Deprivation(predominantly urban) • unemployment, lone parents, low skills base
The Basic Model of the SA-Level Pobal HP Deprivation Index d Age Dependency Rate 1 Demographic d Population Change Growth 2 d Primary Education only 3 d Third Level Education 4 d Persons per Room Social Class 5 Composition d Professional Classes 6 d Semi- and Unskilled Classes 7 d Lone Parents 8 Labour Market d Male Unemployment Rate Situation 9 d Female Unemployment Rate 10
A Longitudinal ED-Level SEM Model, 1991-2006 Initial Growth Rapid Growth Slow-Down There is only a small correlation between the urban and rural components of the index. This confirms the theoretical underpinning of the model which stipulates that urban and rural disadvantage are conceptually different and that the unemployment rate, for example, is not a useful indicator of rural deprivation.
A Multiple Group Model Spanning five Census Waves, 1991-2011 • Multiple Group Model fitted simultaneously across five census waves • imposing identical structure matrix • and identical path coefficients 1991 1996 2002 2006 2011
The Pobal HP Deprivation Index spanning 5 census Waves, based an on ED-Level Analysis Haase et al., 1996 Haase, 1999 Pratschke & Haase, 2001 Pratschke & Haase, 2004 Haase & Pratschke, 2005 Haase & Pratschke, 2008 Haase & Pratschke, 2010 Haase & Pratschke, 2012 Haase & Pratschke, 2011
Mapping Deprivation most disadvantaged most affluent
Overlay of Paired Relative Index Scores, 1991-2006
The Pobal HP Deprivation Measures • Small Area (SA) Level Analysis, 2006 - 2011
The Pobal HP deprivation Index - Dublin Inner City (ED level), 2006
The Pobal HP deprivation Index - Dublin Inner City (SA level), 2006
Towards a Deprivation Index • Covering Multiple Jurisdictions
Methodological Challenges (Overview) • Comparability of Spatial Units (COA, SA) • Comparability of Indicator Variables • Temporal Synchronicity (2011 Census) • Common Dimensionality of Deprivation • Common Statistical Model • Standardisation of Index Scores across Multiple Jurisdictions
Comparability of Indicator Variables • Comparable Indicator Variables • Population Change • Age Dependency • Lone Parents Ratio • Male Unemployment Rate • Female Unemployment Rate • Average Number of Persons per Room • Significantly Varying Indicator Variables • Proportion of Adult Population with Primary Education Only • Proportion of Adult Population with Third Level Education • Proportion of Population in Higher and Lower Professional Classes • Proportion of Population in Semi- and Unskilled Manual Classes
Common Dimensionality of Deprivation v3 Age Dependency Rate d 3 d v2 Population Change Demographic 2 Decline v5 Primary Education Only d 5 d v6 Third Level Education 6 d v11 Persons per Room Social Class 11 Disadvantage d v7 Professional Classes 7 d v8 Semi/Unskilled Classes 8 d v4 Lone Parents Labour Market 4 Deprivation d v9 Male Unemployment 9 d v10 Female Unemployment 10
Standardisation of Index Scores across Multiple Jurisdictions • Joint standardisation of all factor scores • Simple additive approach to combining factors scores • Resulting in comparable deprivation scores North and South, based on an identical factor structure.
HP Deprivation Index for Northern Ireland and republic of Ireland2001/2006
Strengths of CFA-based Deprivation Indices • true multidimensionality, based on theoretical considerations • provides for an appropriate treatment of both urban and rural deprivation • no double-counting • rational approach to indicator selection • uses variety of alternative fit indices to test model adequacy • identical structure matrix and measurement scale across multiple waves • true distances to means are maintained (i.e. measurement, not ranking) • distinguishes between measurement of absolute and relative deprivation • allows for true inter-temporal comparisons • can be developed for multiple jurisdictions
Applications of the • Pobal HP Deprivation Index
Applications of the Pobal HP Deprivation Index • Local development • Local Community Development Programme (LCDP), RAPID • Childcare Initiatives, Family Resource Centres, County Development Plans • Health • Mortality Studies, Epidemiological Studies, Primary Health Care, Health Inequality • Education • Educational Disadvantage, Higher Education Access Route • Environment • National Transport Planning, National Spatial Strategy • Statistical Methods and Research Design • Optimising the Sampling Strategy for CSO Household Surveys • Social Equality / Inequality (EU-SILC, QNHS, GUI, TILDA, SLAN, NDS)
Health Risks and Relative Affluence / Deprivation Deprived Affluent Health Risks SD -3 -2 -1 0 1 2 3 0.1% 2.1% 13.6% 34.1% 34.1% 13.6% 2.1% 0.1% High Moderate Low
Modelling Population Shares according to relative DeprivationT – Total PopulationL – low (48.3%)M – Medium (22.4%)H – High ( 7.4%) L: 0 STD 48.3% Population T : >5 STD (Total Population) M: -1 STD 22.4% H: -2 STD 7.4%
The HSE Resource Analyser 2011 Census of Population Reference Database for 18,488 Small Areas Administrative data on current allocations Data Sources 2011 Pobal HP Deprivation Index Reference Models Combined Target Allocation Model Choices 60% 20% 5% 15% Data aggregation to spatial area of interest (Region, ISA, PCT etc.)
Optimising Sampling Methodologies for CSO Household Surveys Comparison of Sampling Designs in the Estimation of Employment (E), Unemployment (UE), Long-term Limiting Illness (LLI) and Education (ED) Haase, T. and Pratschke, J. Optimising the Sampling Methodology for CSO Household Surveys, CSO, 2012
Small Area Estimation The BIAS project Imperial College London Small area estimation Nicky Best, Sylvia Richardson, Virgilio Gómez Rubio This work is being carried out in collaboration with ONS. The basic methodological problem is to estimate the value of a given indicator (e,g. income, crime rate, unemployment) for every small area, using data on the indicator from individual-level surveys in a partial sample of areas, plus relevant area-level covariates available for all areas from e.g. census and administrative sources. http://www.bias-project.org.uk/resdesc.htm#SAE
Evaluating the resource Distribution for Elderly care: Small Area Estimation(SAE) Use CFA to create Multidimensional Needs Index HSE Administrative data on current Resource Distribution Survey data: TILDA (n = 8,000) Combine data using spatial covariates for Small Area Estimation (SAE) Combine to Area Level (Region, ISA, PCT) SAPS (SA): 2011 Census (n = 18,499) Undertake Gap and Equality Analysis Use Pobal HP Deprivation Index