Download
1 / 22
220 likes | 352 Views
This presentation by Philip Heller outlines the philosophy behind visualization in cancer pathway data, focusing on the ErbB2 pathway, a key factor in breast cancer. It covers best practices in scientific and information visualization, emphasizing the importance of context and simplicity in data representation. The session includes a demonstration of innovative circle graphs and explores future directions, including ad-hoc grouping and canonical layouts to enhance client-side analysis of complex data. Aimed at improving interpretation and interaction, the insights are crucial for researchers and data scientists.

E N D
Client-Side Visualization of Cancer Pathway Data Philip Heller Winter 2019
Agenda • Visualization philosophy • ErbB2 pathway • Demo • Future directions
2 Branches of Visualization • Scientific Viz • Typically engineering data • Measurement • Simulation • High degree of spatial context • Information Viz • No x/y/z/t
Scientific Visualization • f ( 2D / 2D+t, 3D, 3D+t ) = scalar / vector / tensor • Regularity -> Best practices • Natural spatial context -> easier interpretation
Scientific Viz: Fluid Dynamics Source: http://img.directindustry.com/images_di/photo-g/ fluid-dynamics-and-thermal-transfer-simulation-software-387217.jpg
Scientific Viz: Jupiter Source: http://www.mps.mpg.de/projects/planetary-dynamics/JupiterSim.gif
Info Viz • f ( patient / gene / organism ) = scalar / record “You can’t overlook the lack, Jack, Of any other highway to ride. It’s got no signs or dividing lines, And very few rules to guide” -- Robert Hunter, New Speedway Boogie
Possibly the worst info viz ever Source: http://www.math.yorku.ca/SCS/Gallery/
Formalizing Info Viz • A few “don’ts” • Even fewer “do’s” • Start with Edward Tufte • All quotes from presentation 12/10/2009
Complicated Data, Simple Interactions • “The information is the interface.” • “Be content-driven, not process-driven.” • “Local optimizing of interface elements leads to global pessimizing of the interface.” • “No matter how beautiful your UI is, it would be better if there were less of it.”
ErbB2 • Proto-oncogene • Cell surface receptor • Overexpressed in ~ 20% of breast cancer patients • 20% * 1.3 million new cases / yr worldwide = 260,000 new patients/yr with overexpressed ErbB2 (Source: ACS) • Under investigation at UCSC by Haussler & Stuart Labs
The ErbB2 Pathway Source: Zack Sanborn
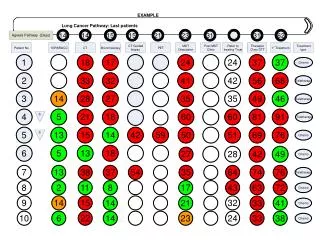
How to study a pathway:For each gene… Hundreds of patients
Solution: Circle Graphs • Developed at UCSC by Steve Benz and Zack Sanborn • Wrap table around central spindle, compress as needed
My Contribution:Circle graphs meet client-side analysis • What are the measurement values behind the heats? • What information in hiding in the white? • How does one ring correlate with others? • Let’s see …
Future Development • Multiple circles, plus relationship lines • Ad-hoc grouping • Ring re-ordering • Canonical layout … • MaGnET …