Download
1 / 50
500 likes | 645 Views
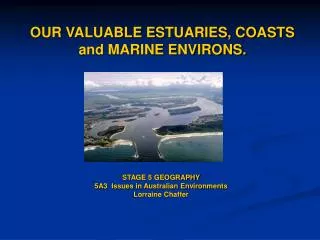
Estuaries and Coasts. Notes Series for Oceanography MARS 2202 by John P. Wnek. Coastlines and Productivity. oceanworld.tamu.edu. Coastal diagram with the area of nearshore and offshore productivity. Beaches. http://www.usa-chamber.com/gulf-beaches/home.html.

E N D
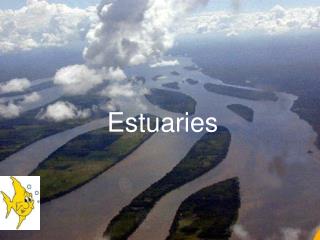
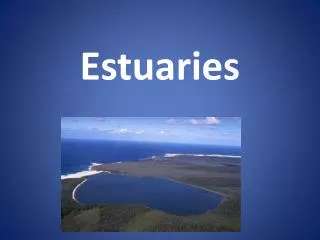
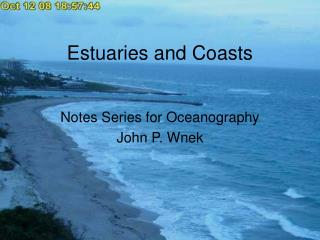
Estuaries and Coasts Notes Series for Oceanography MARS 2202 by John P. Wnek
Coastlines and Productivity oceanworld.tamu.edu Coastal diagram with the area of nearshore and offshore productivity
Beaches http://www.usa-chamber.com/gulf-beaches/home.html
High Productivity Coastal Areas from NASA (SeaWIFS)
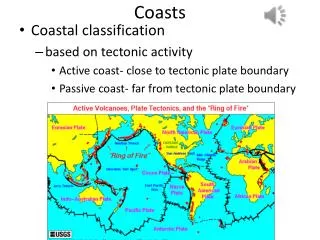
Coastal Types Rocky Coasts Mountain Coasts Northern Boreal Coasts Western Coasts U.S. Barrier Island Coast
Northeast Coast Habitats /www.epa.gov/owow/estuaries/programs/se.htm
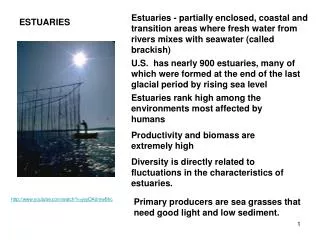
Basic Definition of Estuary – A water body where salt & freshwater mix Technical Definition - “A standing water body within the coastal region where there is a greater net inflow of freshwater than an influx of sea water” J Wnek
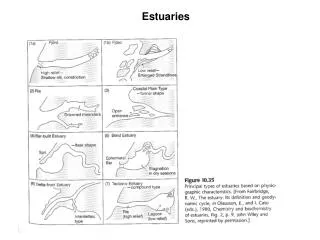
Estuary Types: Classified by Geology • Lagoon – parallel to coast (i.e. Indian River Lagoon, Florida) – Bar-Built Estuaries • Coast Plain Estuary– erosion (i.e. Chesapeake Bay and Pamlico Sound) • Tectonic Estuary– faults (i.e. San Francisco Bay) • Fjord – glacier formation (i.e. Alaska, British Columbia, Norway, Chile)\ • Delta- formed at mouth of a river (i.e. – Mississippi Delta)
Aerial view of Oregon Inlet with highway 12- on Hatteras Island, NC. (Mallison et al. 2009)
Geological sequence of sea level rise and the succession of Pamlico Sound Mallison, Riggs, Culver and Ames, East Carolina University, 2009
ONR.NAVY.MIL San Francisco Bay Estuary – a tectonic estuary
Kejser Franz Joseph Fjord, Greenland Geiranger Fjord, Norway
Factors influencing an estuary • Temperature • Salinity • Nutrients Anthropogenic effects (review) • Increased runoff • Development causing habitat fragmentation • Global Climatic Changes
Temperature • Temperatures may change with shifting tidal regimes • There can be temperature inversions during the evenings, especially in the fall when cooler temperatures may be at the surface.
Key: • Upwelling • Nor’easter Cruz and Wnek, Summer 2012
Classification of Systems • Nontidal Fresh 0 ppt, no tidal influence • Tidal Fresh 0 - 1 ppt, tidal influence • Oligohaline 2 - 5 ppt (slightly brackish) • Mesohaline 8 - 15 ppt (brackish) • Polyhaline 18 ppt and up (salt water)
Salinity • Salinity can vary in estuaries based upon the amount of salt water inflow and freshwater inputs. • Estuaries can be classified according to the layering of salt water based on density - well-mixed - partially-mixed - salt wedge (highly stratified)
Inverse Estuaries • Some estuaries show an increase in salinity over time, these are considered “inverse estuaries” or “negative estuaries.” • There is a net increase in salinity over time mostly due to human impacts (i.e. dams and loss of freshwater flow into the system)
(Zedler et al. 2001) Swan River Estuary, W. Australia (Neira et al., 1992)
Flushing Time? • Considered the amount of time in which all water is totally exchanged in an estuary • Varies according to the estuary due to ocean access, freshwater runoff (called inflow) and depth of the estuary tF = VF / R tF is the flushing time Vf is the freshwater volume R is the river discharge rate
Marsh Zonation • High Marsh – Not flooded regularly with predominant Spartina patens and Phragmites • Series of marsh pools at higher elevations • Low Marsh – Floods regularly with Spartina alterniflora • Creeks and ditches with sometimes tidal effects • Support a higher density of finfish than SAV beds (Sogard and Able 1991).
Anthropogenic Effects on Coastlines Coastal erosion in Norfolk in 1997
Human Impacts and Changes in Estuaries Delaware Bay and human impacts In the past eighteen thousand years, sea level has risen one hundred meters (three hundred feet), converting freshwater rivers into brackish estuaries (Donn, Farrand, and Ewing 1962). The Delaware River is an Alluvial Plain
Delaware River Fluxes in Sea Level Rise Hull, C.H.J. and J.G.Titus (eds). 1997. Greenhouse Effect, Sea Level Rise, and Salinity in the Delaware Estuary.. Washington, D.C.: U.S. Environmental Protection Agency and Delaware River Basin Commission.
Marsh Systems Hartig et al. 2002
Proposed Bruun Model with changing sea level Shifting of dunes and berms in response to sea level rise Davidson-Arnott, R. 2005. Conceptual model of the effects of sea level rise on sandy coasts. Journal of Coastal Research 21 (6): pp. 1166-1172.
Mallison, Riggs, Culver and Ames, East Carolina University, 2009
References Able, K, D.A. Witting, R. McBride, R. Rountree, and K.J. Smith. 1996. Fishes of polyhaline estuarine shores in Great Bay-Little Egg Harbor, New Jersey: a case study of seasonal and habitat influences in Estuarine Shores by K.F. Nordstrom and C.T. Roman (eds.). John Wiley and Sons, England: pp. 335-353. Candolin, U., T. Salesto, and M. Evers. Changed environmental conditions weaken sexual selection in sticklebacks. 2006. The Authors: Journal Compilation in the European Society for Evolutionary Biology 20: pp. 233- 239. Carlson, D.M., and R.A. Daniels. 2004. Status of Fishes in New York: Increases, Declines, and Homogenization of Watersheds. American Midland Naturalist 152: pp. 104-139. Davidson-Arnott, R. 2005. Conceptual model of the effects of sea level rise on sandy coasts. Journal of Coastal Research 21 (6): pp. 1166-1172. Diffenbaugh, N.S., M.A. Snyder, and L.C. Sloan. 2004. Could CO2- induced land cover feedbacks alter near-shore upwelling regimes. Proceeding of the Natural Academy of Science, 101 (1): pp. 27-32. Dybas, C.L. 2006. On a Collision Course: Ocean Plankton and Climate Change. BioScience 56 (8): pp. 642-646. Galbraith, H., R. Jones, J. Clough, S. Herrod-Julius, B. Harrington, and G. Page. 2002. Global Climatic Change and Sea Level Rise: Potential Losses of Intertidal Habitat for Shorebirds. Waterbirds 25 (2): pp. 173-183. Guo, Q., N. P. Psuty, G.P. Lordi, S. Glenn, and M.R. Mund.1995. Hydrographic Study of Barnegat Bay, Year 1: Volume 1 and 2. Prepared by the Rutgers the State University of New Jersey, New Brunswick, NJ, for the New Jersey Department of Environmental Protection, Division of Science and Research. Guo, Q. and Valle-Levinson. 2007. Tidal effects on estuarine circulation and outflow plume in the Chesapeake Bay. Continental Shelf Research 27: 20-42.
References (cont’d) Gray, V.R., 1998. "The IPCC future projections: are they plausible". Climate Research 10 pp. 155-162 Green, R., J.E. Maldonado, S. Droege, and M.V. McDonald. 2006. Tidal Marshes: A Global Perspective on the Evolution and Conservation of their Terrestrial Vertebrates. BioScience 56 (8): pp. 675 – 685. Hartig, E.K., V. Gornitz, A. Kolker, F. Mushacke and D. Fallon. 2002. Athropogenic effects and climate-change impacts on salt marshes of Jamaica Bay, New York City. Wetlands 22 (1): pp. 71 – 89. Hull, C.H.J. and J.G.Titus (eds). 1997. Greenhouse Effect, Sea Level Rise, and Salinity in the Delaware Estuary.. Washington, D.C.: U.S. Environmental Protection Agency and Delaware River Basin Commission. Jones, R. and E. Strange. 2006. A Pilot Study of the Ecological Consequences of Human Responses to Sea Level Rise. Stratus Consulting Inc., Boulder Colorado as part of a supporting document for the Barnegat Bay National Estuary Program’s Conservation and Management Plan (item 4.1): pp. 1- 61. Neira, F.J., I.C. Potter, and J.S. Bradley. 1992. Seasonal and spatial changes in the larval fish fauna within a large, temperate Autralian estuary. Marine Biology 112: 1- 16. Ogdon, J., S.M. Davis, T.K. Barnes, K.J. Jacobs, and J.H. Gentile. 2005. Total System Conceptual Ecological Model. Wetlands 25 (4): 955-979. Reed, D.J., D.A. Bishara, D.R. Cahoon, J. Donnelly, M. Kearney, A.S. Kolker, L.L. Leonard, R.A. Orson, and J.C. Stevenson. 2006. Site-specific scenarios for wetlands accretion as sea level rises in Mid-Atlantic Region. Supporting document for CCSP 4.1 to Climatic Change Division U.S. Environmental Protection Agency: pp. 1- 54. Zedler, J.B. 2005. Restoring wetland plant diversity: a comparison of existing and adaptive approaches. Wetlands Ecology and Management 13: 5-14.