Download
1 / 15
150 likes | 264 Views
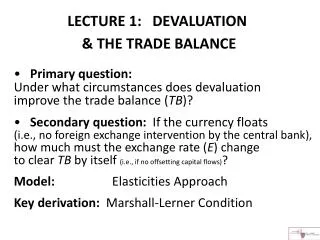
LECTURE 1: DEVALUATION & THE TRADE BALANCE. Primary question: Under what circumstances does devaluation improve the trade balance ( TB )?

E N D
LECTURE 1: DEVALUATION & THE TRADE BALANCE Primary question: Under what circumstances does devaluation improve the trade balance (TB)? Secondary question: If the currency floats (i.e., no foreign exchange intervention by the central bank), how much must the exchange rate (E) change to clear TB by itself (i.e., if no offsetting capital flows)? Model: Elasticities Approach Keyderivation: Marshall-Lerner Condition
GOODS MARKET PRICING IN OPEN-ECONOMY MODELS: OVERVIEW OF ALTERNATIVE ASSUMPTIONS IN API120
GOODS MARKET PRICING IN OPEN-ECONOMY MODELS: ALTERNATIVE ASSUMPTIONS(continued)
GOODS MARKET PRICING IN OPEN-ECONOMY MODELS: ALTERNATIVE ASSUMPTIONS(continued)
We interrupt this lecture for an announcement… Expectations for Classroom Behavior Be on time. Bring your name card. No side conversations. Eat responsibly. Leave class for emergencies only. No electronics in class unless specifically permitted. Cell phones off.
The Marshall-Lerner Condition:Under what conditionsdoes devaluation improve the trade balance? • We can express the trade balance either in terms of foreign currency: TB*, • e.g., if we are interested in determining the net supply of foreign exchange in the fx market (balance of payments) • Or in terms of domestic currency: TB • e.g., if we are interested in net exports as a component of GDP ≡ C+I+G+(TB). • We will focus on TB* here, and on TB in Prob. Set 1.
How the Exchange Rate, E, Influences BoP • No capital flowsor transfers=> BoP = TB • Supply of fx determined by EXPORT earnings • Demand for fx determined by IMPORT spending 2) PCP: Price in termsof producer’s currency; Supply elasticity = ∞ . => Domestic firms set . & Foreign firms set . 3) Complete exchange rate passthrough: Price of X in foreign currency = / E Price of Imports in domesticcurrency=E 4) Demand: adecreasing function of price in consumer’s currency => M = MD (E ) . => X = XD ( / E ) . => Net supply of fx= TB expressed in foreigncurrency ≡ TB* = ( /E) XD( /E) - ( ) MD(E) .
Derivationof theMarshall-Lerner Condition TB* = (1/E) XD(E) – MD(E) . Differentiate: Multiply by E2/X. This quantity > 0 iff Define elasticities: The condition becomes: .
Assume for simplicity we start from an initial position of balanced trade: EM=X. Then the inequality reduces to This is the Marshall Lerner condition. If the initial position is trade deficit (or surplus),then the necessary condition for dTB*/dE > 0 will bea bit easier (or harder) for the elasticities to meet .
Do devaluations improve the trade balance in practice? • A few historical examples • Italy 1992-93 • Poland 2009 • Turkey 2014 (from reading list: A Weakening Currency Could Mean Strength for Turkish Exporters,” NY Times, Apr. 11, 2014.) • The J-curve and econometric estimation of elasticities(in Lecture 2)
) 1992 devaluation Rise in tradebalance ERM crisis & devaluation
Poland’s exchange rate rose 35% when the GFC hit, .Depreciation boosted netexports; contributiontoGDPgrowth >100%. Exchange rate Zloty / € Contribution of Net X in 2009: 3.1 % of GDP >Total GDP growth:1.7% Source: Cezary Wójcik
Empirical estimates of sensitivity of exports and imports to E & Y • For empirical purposes, we estimate by OLS regression • with allowance for lags, giving J-curve; • shown in logs, giving parameters as: • price elasticities, and • income elasticities. • Illustration: Marquez (2002) finds for most Asian countries: • Marshall-Lerner condition holds, after a couple of years, and • income elasticities are in the 1.0-2.0 range. log X