Download
1 / 14
180 likes | 546 Views
Analog Devices ICs for In Vitro Diagnostics Equipment. Agenda. In Vitro Diagnostics Overview Example Application: Flow Cytometry General block diagram Detectors & Sensors Amplifying signals from photodiodes Digitizing the analog signals Digital processing

E N D
Agenda • In Vitro Diagnostics Overview • Example Application: Flow Cytometry • General block diagram • Detectors & Sensors • Amplifying signals from photodiodes • Digitizing the analog signals • Digital processing • Steering cells into collection chambers • Additional Information & Resources
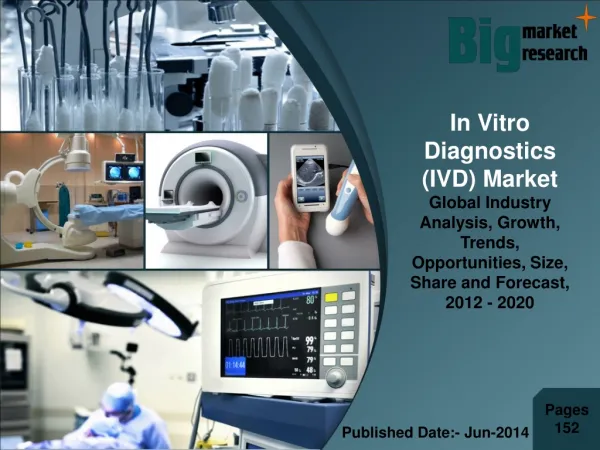
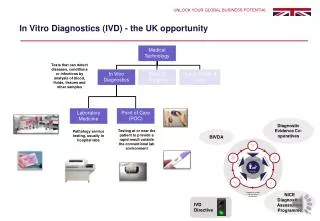
In Vitro Diagnostics Overview • Testing tissue or fluid samples • Used in diagnosis and monitoring applications in humans and animals • Example applications: • Cellular analysis – hematology, flow cytometry • Chemistry – glucose, cholesterol, electrolytes, proteins, enzymes • Immunoassay – determines concentration of a substance by measuring reaction of an antibody • Electrophoresis – protein, DNA, RNA analysis
Flow Cytometry • Flow Cytometry is a process through which cells are differentiated according to cell characteristics • Size, Granularity, Structures present, Reaction to a compound • Application • Separate specific cell types from heterogeneous mixture • Determine cell reaction to compounds • Development and testing of new drugs • Detect presence of cells in small quantities • Benefits of Flow Cytometry • Detection of biological agents in minutes • Capable of detecting agents at low concentrations
CytometryProcessor ADC Photo-diode LightSource AMP Pulsed voltage CellCharger DAC - + DeflectionPlates How does Flow Cytometry work? Sorting cells, one by one • Stained cells pass in front of light source • Deflection plates can steer charged cells into different containers Amp Requirements • Wide BW for fast signals • Low bias current • Low input capacitance • Fast Settling Time DAC Requirements • Applies charge to each cell • Multiplies pulses – must have wide BW to accommodate different cell velocities (500kHz – 2MHz) • High Speed Interface
Flow Cytometry Detectors/Sensors • Photomultiplier tubes (PMTs) & Avalanche photodiodes (APDs) • Fluorescence detection in 400-1000 nm wavelength range • high sensitivity • high internal gain (106) • fast response (10−7 to 10−9 s) • yield a large S/N due to their internal gain • Next generation: Solid-state lasers and PIN-based photodetectors • a few nA of current in the PIN photodiodes, a lock-in amplification technique is applied to increase the signal to noise ratio • lock-in circuit parameters such as the time constant and sensitivity are selected to maximize signal to noise ratio at the given modulation frequency
C2 f = SIGNAL BW 2 R2 f = OP AMP UNITY _ u GAIN BW PRODUCT I C1 f 1 u Total Input f = p 1 2 R2 C1 Capacitance + –V 1 B f = p 2 2 R2 C2 OPEN LOOP GAIN f = f f • GAIN 2 1 u UNCOMPENSATED C1 NOISE C2 = p 2 R2 f GAIN u COMPENSATED FOR 45° PHASE MARGIN f f 2 u 1 f f = p 2 2 R2 C1 f f 1 u Amplifying Signals from High Speed Photodiodes
Photodiode Preamp Example using AD8067 C2 = 0.35pF CD = 4pF, CIN = 4pF C1 = CD + CIN 33.2k 33.2k 33.2k +12V D1 – AD8067 C1 = 8pF –10V + fu = 350MHz D2 D1,D2: IF-D91 33.2k –12V C3 = 0.35pF Bandwidth: 7MHz Output Noise: 725µV RMS, 21MHz 550µV RMS, 10MHz 33.2k 33.2k
Comparison of Op Amps for Photodiode Preamps Unity GBW fu, MHz 25 65 40 350 24 Input Capacitance CIN, pF 23 6.6 4 4 2.5 fu/CIN MHz/pF 1.1 9.85 10 87 9.6 Ib pA 2 2 1.5 2 <1 VN@10kHz nV/Hz 6 7 11 7 7 *AD8610/20 AD8065/66 AD8033/34 AD8067 G > 9 Stable AD8615/6/8 * Ideal low frequency precision preamps for large area photodiodes operated in photovoltaic mode (zero volt bias)
ADC Requirements: SNR & Sample Rate • Bench-top Equipment • Good SNR (typically 12+ ENOBs ≈ 72+ dB of SNR) • Low power to minimize heat • Larger Equipment • Excellent SNR (16+ ENOBs ≈ 96+ dB of SNR) • Frequently use over-sampling to increase SNR in digital domain • Can average many samples to reduce noise. • New SNR = SNRDATASHEET + 10*Log(FSAMPLE/2*BW) • Example:AD9446 SNR = 82dB at 80MspsCustomer BW is 2 MHzEffective SNR of AD9446 will be:82dB + 10*Log(80MHz/4MHz) = 82dB + 13dB = 95dB • The right ADC choice depends on: • Power • SNR • Sample Rate
Some Recommended ADCs • Benchtop Equipment (low power, multi-channel) • AD9252 & AD9259: 14 bits, 8 & 4 channel ADCs with serial LVDS output • AD7621: 16 bits, 1 channel ADC with very low power (86mW) • Large Equipment (best performance, highest SNR) • AD9446 – 82dB SNR at 80Msps • AD7625 – 90dB SNR at 5Msps • Higher Resolution & Lower Sampling Rate ADCs
Digital Processing in Flow Cytometry • Each cell produces a Gaussian distribution of a/d conversions as it passes the sensors • FPGA Tasks • Take each sample above a threshold. 50Mhz converter. • Do a numerical integration (rectangle addition), this is the Area • Determine Base Width based on threshold • Pass to the DSP • DSP Tasks • Receive FPGA dispersion • Convert to floating point • Compensate for filter overlap • Compare to desired cell type • Steer cell (desired or non desired) via high voltage
Steering the Cells into ContainersGenerating pulsed voltage to charge cell DAC Requirements • Very fast throughput • >10MHz Bandwidth • Fast digital interface • Support Low voltage designs • ± 10V Reference with 2.5V to 5.5V supply • Current output – convert to voltage with op amp • Extended temperature range Pulsed voltage CellCharger - + DeflectionPlates
Additional Information & Resources • Motor Control Solutions • Current Sense Amplifiers • Gate Drivers • Resolver-to-Digital Converters • Digital Potentiometers • Temperature Sensing and Thermal Management • Analog Temperature Sensors • Thermocouple Conditioners • Digital Temperature Sensors • Fan Control • Other Medical Solutions from ADI