Download
1 / 22
220 likes | 311 Views
Medium and Long Term Market Influences: What is the Equilibrium Price for Tomorrow’s Copper?. Paul Dewison of Bloomsbury Minerals Economics FINEX Conference – October 28 th 2010. Topics Addressed. Copper demand: How sustainable is its growth?

E N D
Medium and Long Term Market Influences: What is the Equilibrium Price for Tomorrow’s Copper? Paul Dewison of Bloomsbury Minerals Economics FINEX Conference – October 28th 2010
Topics Addressed • Copper demand: How sustainable is its growth? • Historically, copper moved in tandem with industrial production • There was a major disconnect as prices rose from 2004 to 2008 • What does the future hold? • Copper supply: Enough to cover demand growth? • Lack of good new projects and unstable supply a growing market feature • If demand growth holds, will there be enough copper? • Copper price: Not just a story of physical fundamentals • With fund involvement, we need to consider the virtual market balance as well as what the physical market can tell us • The implications for medium term price are positive, if less certain than a traditional supply-demand-price analysis would suggest • Longer term, fund influence should retreat and prices stabilise at a more sustainable level
Copper Use and Industrial Productionat first sight, the two appear to move hand in hand IP & Refined Cu Use (Index) IP & Refined Cu Use Change IP Change & Cu Use /IP Growth Differential • Over the 20 years 1990-2010, refined Cu use moves more-or-less in line with IP • Historically, Cu use was more volatile than IP, but not in 2009 • Copper appeared to be losing ground seriously against IP 2005-2008 • The lost ground was regained in 2009 and appears to have been held in 2010 • Will copper use resume its close relation to IP in coming years?
Copper Price, Copper Use and IPthe relationships between the three are not straightforward Copper Price & Refined Cu Use Change Copper Price Change & Cu Use/IP Differential Copper Price & Cu Use/ IP Differential • Changes in copper use have shown no obvious relation to price in the past • Where there is a relationship, causality can run either way, leading to opposite outcomes (i.e. high prices can limit consumption, low consumption can limit prices - all else being equal) • Copper price change can be linked to the differential between Cu use growth and that in IP: Rises in copper price tend to mean a negative differential (lower copper use)
Copper’s Products and Applicationsdynamics of consumption should be assessed for each product/application cell
Structural Trends by Main Market Segmentmixed prospects for most areas, but some serious negatives
The Impact of Price on Consumption Re-assessedsubstitution is most sensitive to the copper price
The Opportunities for Copper in New Marketselectric vehicles, power infrastructure and premise markets all offer opportunities • The main opportunities in copper have 3 focal points – each driven to a greater or lesser extent by the need to reduce carbon emissions and to create a stable energy future • The focal points in order of importance are: (1) Transport (electric & hybrid vehicles); (2) Power infrastructure (distributed & renewable energy, smart & integrated networks; (3) Premise & Equipment (enhanced wiring, efficient systems and equipment) • Taken together, new markets are expected to contribute around 1.0Mt of consumption over the next decade
Long Term Prospects for Copper Consumptionwill copper continue to hold its own against ip? Status Quo Market Development Trend 1% Loss of Cu Use Against IP • Historically, both IP and Cu use had growth at a trend rate close to 3% p.a. • Similar (slightly higher) IP trend growth is expected for the long term • The experience of 2005-2008 has shown that while copper usually moves with IP it can underperform when prices are high. Some divergence is forecast by 2015 • Very high prices sustained over a long period opens up the very real possibility of a sharp divergence between IP and price (see chart on right)
Copper Output and Copper Usesame trend growth, but significant annual disparities Refined Cu Output & Refined Cu Use (Index) Refined Cu Output & Refined Cu Use (%change) Refined Output/Use Differential & Usage Growth • Both copper output and use grew at a trend rate of 3% p.a. 1990-2010 • In individual years, wide disparities between output and use emerge, with differences in growth rate of over 2% p.a. being commonplace • This suggests that supply is not particularly responsive to demand, at least in the short term
Copper Price, Copper Output and Usesupply responds to price stimulus, but growth appears capped Copper Price & Refined Cu Output Change Copper Price Change & Cu Output/Use Difference Copper Price % Cu Output/ Use Difference • At face value, history has shown no obvious relationship between price and output • In general, copper output has underperformed copper use growth at times when prices have been rising • The period 2004-2008 was an exception, as output rose faster than use, in part reflecting a strong supply response in the context of very high prices • Even given price stimulus, it appears that copper is not able to sustain an output rise of more than around 4% p.a.
Constraints on Copper Supply Growthageing mines, lower ore grades, operational constraints, political and economic risk combine to limit output growth • At some large existing mines ore grades are falling • e.g. Escondida, CodelcoNorte, and La Candelaria • In traditional mining areas new ore grades are typically lower (around 0.6% Cu) • New high grade mine projects are mainly in remote or high risk regions • Global constraint on the availability of engineering services & skilled workers • Local constraints on water and power supplies • Capital and operating costs are rising • Strikes and tougher tax regimes are being encouraged by high prices • Unexpected and serious problems emerging with some host governments • e.g. The revoking of First Quantum mining licences in D.R.Congo • Environmental issues threaten to scupper viable projects • e.g. A ban on open pit mining in part of the Philippines, threatening Tampakan • Arsenic impurity affecting some projects, with limited treatment facilities conclusion: copper output unlikely to hold its historical growth rate except under very high prices
The Big Copper Projects to 2015 (intierra)small number of projects over 100 ktpy after esperanza confirm the possibility of a supply shortfall
Long Term Prospects for Copper Outputif copper use continues unabated, a supply shortfall is likely Status Quo Market Development Possible Supply Shortfall if Demand Unabated • If copper carries on as before, we should see a trend rise in output and use of 3% p.a. • Some commentators now believe that copper faces an absolute supply growth cap of around 2.5% p.a. • Given very high prices output may perform better, but at prices below around $5,000/t, low investment should mean output growth of 2% p.a. or less • Considering the above, a significant supply shortfall looks likely unless prices are sufficient to encourage new capacity, and reduce consumption
Where Is The Market Equilibrium? (1)physical demand / supply economics give little insight on price • Traditionally, analysts have expected price to move along with the physical market balance, as indicated by the movement in exchange stocks • This chart shows just how little explaining power this type of analysis offers • Either the stock to price curve is subject to frequent realignment, or we should be looking somewhere else entirely to explain price • In fact both are true, and long investment is the common driver • Investment longs, a growing feature of the market, tend to shift the stock price curve upwards and to the right, meaning that for any given price, the market will sustain a higher level of exchange stock than previously
Where Is The Market Equilibrium? (2)How investors’ long positions in the futures market offset the bearish effect of high stocks in the physical market • The relationship of exchange stocks to price has two elements: • 1) The level and direction of change of total stocks are good indicators of physical market conditions generally and, via sentiment, indirectly affect price, mostly rather gently • 2) In the normal contango market, exchange stocks are hedge sold forward. This locks up stock in the futures market, directly depressing prices • Investor longs affect the second of these relationships, long investment directly counterbalancing the contango-earning hedge shorts and raising the price corresponding to any given stock level • Thus, a new market equilibrium emerges: Old Equilibrium Cu Output = Cu Use Stock Change = Zero Consequences for Price Higher prices are required to stimulate an equilibrium rate of stock increase A contango is needed so that exchange stocks are hedged New Equilibrium Cu Output = Cu Use + Net Tonnage Bought by Investors Stock Change = Investment Holdings Change
Where Is The Market Equilibrium? (3)investor long contribution to virtual balance raised prices Exchange Stocks and Cu Price Virtual Balance and Cu Price Investor longs often work to greatly accentuate a physical market imbalance but can, as in 2008, run counter to it
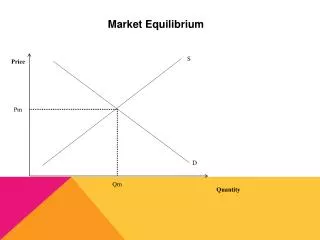
Where Is The Market Equilibrium? (4)physical equilibrium where demand and supply curves cross Cu Output and Use Annual Volume Change at Different Prices* • Since 2004, prices have been influenced by investment longs, allowing high prices and quite high stocks to co-exist • In the short to medium term, investor long influence should rise, especially if ETFs become a part of copper’s landscape • For the period to 2015 we expect prices to range up to $9,000/t on an annualised basis, at the cost of large increases in physical stock (around 800 ktpy at $8,500/t, 500 ktpy at $7,500/t, 250 ktpy at $6,500/t) • By mid-decade, fresh investment in copper should subside, not least because of the build up of physical stock. Long term, prices may move close to the physical market equilibrium of around $5,500/t * The annual volume changes above are based on a notional 20 Mt market
Copper Price Prospects Beyond 2015? (1)prices are quite likely to revert to the physical equilibrium point ($5,500/tonne) A Notional View of Copper Market Balance and Price to 2030
Copper Price Prospects Beyond 2015? (2)huge investment inflow would be needed to allow sustained higher prices • Here we consider the implications of a constant price of $6,250/tonne • There would be structural gap of about 1% p.a. between supply growth (boosted by the higher price), and demand growth (constrained by price) • A huge cumulative rise in annual market surplus would result, meaning the build up of visible stocks to levels many times what we have seen to date • This increase couldbe offset by drawdown of virtual stock through fund investment and ETPs, but only if such investment reaches many times the level we are seeing today • So, sustained prices even modestly above physical market equilibrium imply a very different type of copper market An Alternative Notional View of Copper Market Balance and Price to 2030
ConclusionWhat is the Equilibrium Price for Tomorrow’s Copper? • Copper Demand: Despite new markets, consumption growth is vulnerable at high prices • Copper Supply: Difficult to sustain growth much above 2.5% p.a., even at high prices • Price Dynamics: Prices no longer relate simply to the physical market balance, as investor longs influencing the effective (or “virtual”) market balance need also to be taken into account • Equilibrium Prices: We estimate that a physical market equilibrium can be achieved at around $5,500/t at 2.5% p.a. growth in both copper output and copper use. Investor influenced prices may be higher • Medium Term Prices: Growing investor commodity exposure and the introduction of ETFs should buoy up prices beyond the physical equilibrium price to at least 2013, taking average annual prices up to as much as $9,000/t • Long Term Prices: Growing physical stocks and a move of investors away from commodities is likely to lead to an erosion of prices towards the physical market equilibrium point ($5,500/t), but continued growth in investment may allow sustained pricing above this
While this presentation has been prepared with care, Bloomsbury Minerals Economics Ltd makes no warranty regarding the contents, and shall not be liable for any incidental or consequential damages arising out its use. Further information on BME price models and whole industry models can be obtained from Robert Goldstein: rbg@bloomsburyminerals.com The Interactive Copper Price Model is available on a multi-client basis for a license fee of £10,000 per annum. Sponsorship opportunity available for the proposed Copper Whole Industry Modelprice on application. BME’s monthly Copper Briefing Service is available at a price of £1,850 per annum for a single user. See also our website: www.bloomsburyminerals.com