The EMPA practical Exam
140 likes | 329 Views
Learning Objectives. The EMPA practical Exam. To provide an exam “crib sheet” for the EMPA practical exams (Unit 3 and Unit 6) by reverse engineering the previous mark schemes To avoid losing marks for silly mistooks and to “take the hit” for the odd hard mark lost.

The EMPA practical Exam
E N D
Presentation Transcript
Learning Objectives The EMPA practical Exam To provide an exam “crib sheet” for the EMPA practical exams (Unit 3 and Unit 6) by reverse engineering the previous mark schemes To avoid losing marks for silly mistooks and to “take the hit” for the odd hard mark lost References : Unit 3 Specimen Unit 3 June 2009 Unit 6 Specimen
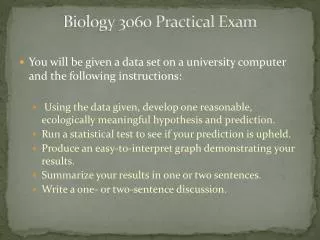
Read through the paper! This is the first thing you will do when you enter the room!
There is typically a 8 or 9 mark planning question in the part 2 written part of the EMPA, they look easy but are normally answered badly (half marks at best) Your answer needs to be structured and complete. Old style mark schemes adopted the following structure which is reasonable Measurements Strategy (method) Control Difficulties Planning Questions
Measurements • State all the measurements which need to be taken and the piece of apparatus used to take the reading. • Especially remember the obvious ones, rulers, balances and stopwatches • Take care to consider multiple readings (mean) especially for measurements such as diameters taken with a micrometer Planning Questions 2
2. Strategy (method) • A detailed description of how to conduct the experiment, which explains how to use your measurements to achieve the objective. Connect with underlying Physics and Maths equations e.g. Diameter to area calculation • Usually, your method should suggest a graph being plotted (details of axis etc) and will probably use the gradient and/or intercept to produce the result you’ve been asked to find • Remember repeat readings and mean averages • Remember use of set squares, protractors and plumb bobs to establish “squareness” Planning Questions 3
3. Control • Remember to describe the things you will keep the same. • Your practical should only have a single independent variable • Some of this may discuss limiting environmental change such as temperature and draughts etc Planning Questions 4
4. Difficulties • Describe what the difficulties may be and how to limit or overcome their effect • Multiple readings and mean (Especially diameters) • Reduce uncertainties by making readings as large as possible • Reduce parallax errors • Take care with “squareness” and “parallelness”. Either use set square, protractor, plumb bob or perhaps multiple readings at several points Planning Questions 5
4. Difficulties Note:- If you use “taking repeat readings and average” as a suggestion for how to overcome a difficulty. Don’t say “To make my results better” Say “To reduce uncertainties and identify anomalous readings” Planning Questions 5
Taking readings Ensure that all readings are taken to the precision of the instrument used (e.g. To the nearest mm for ruler or degree for a protractor) Ensure that the same number of significant figures are used... 2.3cm, 3.4cm & 1cm (1cm should be 1.0cm) Take care with the number of sets of readings, often instructions are unclear... Phrases such as “take 4 readings” often mean 4 more readings in addition to the one initially taken during the detailed description If in doubt take one more set! Remember a graph needs an absolute minimum of 5 readings During the Practical
IF IN DOUBT TAKE REPEAT READING SETS AND FIND THE MEAN (YOU HAVE THE TIME) Ensure that you have a good range of results. Not a bad idea to play first Discussing readings Often you will be asked to describe how you took certain readings... Often the correct answer involves the use of a set square, protractor, plum bob, multiple readings to ensure things are parallel or finding the midpoint of something “Things may not be in the same plane”, “squashing things with a micrometer” During the Practical
Tabulating Results Ensure that independent variable is in the 1st column x/mm y/g z/V Note the way the unit is shown as “dividing” the quantity. This is how AQA want it If you have to add a column for measurements raised to a higher power (e.g. T4 or x2), then remember to quote those raised values to 3 s.f., 2 s.f. is not enough. During the Practical
Size : As large as possible (at least 8x8). Remember there are 4 combinations of axis/paper orientation False origin (i.e. Axis only consider the data range) may be ok Sharp pencil : single sharp lines Double check you have the axis as instructed, (often the independent variable along the bottom) Sensible scale (1,2,5,10 etc per box not 3, 7, 19 etc) Label each axis with quantity and unit (x/mm) Title All points plotted correctly (double check) small vertical/horizontal cross recommended to the nearest mm Graphs 1
Single clean line of best fit (label this as line of best fit) Remember if the line must pass though the origin then the line of best fit is effectively “a radius” you can change the angle not the horizontal or vertical offset Often ideally each data point should be 2mm from the line of best fit. Jolly hard! Do not panic! Double check plotting and possibly double check anomalies Gradient : As large as possible (> 8x8), construction lines shown, show y & x on the graph with units If tangent is required, still meet 8x8 criteria Graphs 2
Part B : The written practical paper Remember “state and explain” can hide 2 marks Often you will be asked which result has the greatest percentage uncertainty.... For a fixed absolute uncertainty... This will be your smallest reading Calculating the percentage uncertainty (we await AQA) Show working (as always) You may be asked to comment upon the validity of a given uncertainty.... i.e. Compare a predicted uncertainty with one found from the range in a set of results (USE MY UNCERTAINTY NOTES ONCE FIXED) Uncertainties