Download
1 / 28
280 likes | 381 Views
The JWST Tunable Filter Imager (TFI) . René Doyon , Université de Montréal, J. Hutchings (HIA), R. Abraham ( UofT ) , L. Albert ( UdeM ), B. Barton (UC Irvine), M . Beaulieu ( UdeM ), P . Chayer ( STScI ),

E N D
The JWST Tunable Filter Imager (TFI) René Doyon,Université de Montréal,J. Hutchings (HIA),R. Abraham (UofT), L. Albert (UdeM), B. Barton (UC Irvine), M. Beaulieu (UdeM), P. Chayer (STScI), L. Ferrarese(HIA), A. Fullerton, (STScI),R. Jayawardhana (U.ofT),D. Johnstone(HIA), D. Lafrenière (UdeM), A. Martel (STScI), M. Meyer (ETH), J. Pipher (U. Rochester), N. Rowlands (COM DEV), M. Sawicki(St-Mary’s), A. Sivaramakrishnan(STScI), K. Volk (STScI) & K. Saad (CSA).
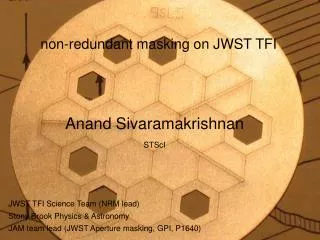
TFI at a glance • FOV: 2.2’x2.2’ • 65 mas pixel sampling • 2048x2048 pixels (Hawaii 2RG) • Wavelength range: 1.6-2.6 μm and 3.2-4.9 μm • (actually 1.5-2.7 μm and 3.1-5.1 μm) • Resolving power of ~100 (80-120) • Low-order Fabry-Perot + 8 blocking filters • Sensitivity, 10σ 10x1000 s • Operating modes • Normal imaging • Lyotcoronagraphy • 4 occulting spots, 3 lyot masks • Non-Redundant Masking interferometry (NRM) ×10-19 ergs/s/cm2
Spectral Resolution First Light (Z>11.0 LAE) Exoplanets
TFI Coronagraphy • 4 occulting spots engraved on the pick-off mirror • Diameters of 0.58”, 0.75”, 1.5” and 2.0” • 3 lyot masks • Transmissions of 71%, 66% and 21% • Robust against pupil shear up to 4% • Performance validated in the lab
TFI coronagraph testbed Theory Measured with coronagraph (observed/theory) Beaulieu et al (2008)
Multi-Wavelength PSF subtraction(Spectral Differential Imaging) • Image of the target itself at a different wavelength is used as a reference PSF image. • Works with either a sharp spectral feature or a flat spectrum. • Demonstrated in the labwith a prototype etalon + detailed on-orbit simulations. See poster by P. Ingraham for more details on SDI performance
TFI contrast limits For a pupil shear of 2% Contrastimprovementwith SDI
NonRedundant Mask – A unique niche goal • Three NRM posters: • Anand Sivaramakrishnan et al • SaavikFord et al • Barry McKernan et al NIRCam & MIRI contrast from Beichman et al. 2010 TFI curve assumes only a modest PSF subtraction performance Beichman et al 2010
Example: LAE galaxy at z=6.96 TFI R=100 BANDPASS Iye et al. (2006). Nature443. 186 High-Redshift Science with TFI • The Niche for TFI • Lyαcan be 20x as bright as the continuum for a Lyman Alpha Emitting (LAE) galaxy. • But the Lyα has to escape the neutral IGM! So the ionized region has to be large enough that the expanding Universe redshifts the photon off resonance by the time it hits the neutral IGM. • This means the ionized bubble has to be ~1 Mpc in size. Single sources might not dig out holes this big but one expects sources to be clustered. • Lyαis redshifted into the TFI λ range for z~11-30. • Frustratingly, the regime from z=7 to z=11 is going to be missed… we now know this is likely to be interesting territory. For z<11 the best one can do is chase a Helium line for sources in this range to try to confirm that the source is a Population III object.
z=12, IMF=1-100 Msun, Z=1e-3 - - - - z=12, IMF=1-500 Msun, Z=1e-4 . . . . . . z=12, IMF=50-500 Msun Z =1e-7 Predictions of Lyman Alpha emitting galaxies at z=12,15,30 are highly speculative Can make a guess by using the parameters (IMF, metallicity, photon escape fraction) defined by population of LAEs at z=6.5 Kashikawa et al (2006) However, THIS IS EXPLORATORY SCIENCE A single 2.7 hour pointing is sufficient to detect a LAE in the more optimistic, but plausible scenarios. Multiple pointings probe more volume and lead to higher possible detections. Redshifts>12 require lensing or more pointings. z=12 Can ‘tune’ TFI to redshifts of suspected galaxy overdensities soon to be predicted from high-z 21cm mapping of neutral hydrogen, increasing chances even more. 1 TFI pointing (2.7h) 10σ detection at2.3e-18 ergs/s/cm2. z=30 4 TFI pointings z=20 However… the bottom line: we want to go as blue as possible. z=15 16 TFI pointings
Strategic Considerations • TFI has a useful niche but the risk of finding nothing with a totally blind search is unacceptably high. • By 2018 radio observations of redshifted 21cm may inform things so that the odds are much better and searches won’t be blind. But we can’t yet assume that. • Alternatively, a good strategy would be to come up with a plan that is guaranteed to deliver excellent science with a high-z galaxy search as a by-product.
A hybrid cluster galaxy assembly + first light campaign • The concept is a narrow-band imaging survey of galaxies in z~1.3 clusters, with detection of lensedz>11 galaxies occurring if we get lucky. Science goals will focus on the demographics of galaxy assembly in dense environments. • TFI will be tuned to the systemic velocity of the clusters, isolating the star-forming population from the field population by probing Hα emission. • TFI’swavelength coverage is ideal for probing the cluster velocity field (the spectral resolution spans ± 1500 km/s about the cluster’s systemic velocity). • TFI high spatial resolution will map star-formation structures in individual galaxies as they assemble in the proto-cluster environment. • TFI’s large FOV is perfect match to the the Einstein radii of rich clusters at high-z, optimizing the probability of detecting strong lensing of background z>11 galaxies. The complex topology of the strong lensing caustic network will be fully sampled. • The sample will exist by 2018, in fact red sequence + SZ-selected clusters at suitable redshifts are already being found. • Additional confusion of background high-z systems with foreground cluster members is the price to be paid by this strategy. Efficient removal of false positives will require coordination with ground-based facilities and other JWST instruments.
TFI has unique capabilities • NRM interferometry • ~10 mag contrast at 70-400 mas • Niche: within IWA of NIRCam/MIRI/TFI coronagraphs (<0.3”) • High-contrast at ANY wavelength (spectral information) • Niche: spectral characterization of known planets • Narrow features at >3 μm, high contrast planets • Spectral differential imaging • 10X attenuation demonstrated • Niche: cool planets (low-mass/old) • Greater benefit, and works closer in, when sharp spectral features present
Search for planets in Star-Forming Regions • Essential to study the primordial stateof planetary systems • After a few 10s of Myr, planetary systems areexpected to have evolved significantly • Insight into formation process • Direct probe into planetary system evolution • By comparing with older planet populations • Good test of interior and evolution models • Luminosity function at a few distinct young ages • SFRs of interest: Taurus [1-2 Myr] and Scorpius-Centaurus [5-15 Myr] • These SFRs are distant (~150 pc) and suffer high extinction (Taurus) • Need to probe <0.5” (ie <75 AU) • Many stars are faint in optical (I>8), hence cannot be done with ground-based AO • Relatively untapped by 2018, particularly solar and lower masses
Planets in Star-Forming Regions – Contrasts 10 mag 1-2 MJup 75-400 mas 10-60 AU TFI/NRM limit
Detection completeness example – A low-mass star in Upper Scorpius • >50% complete for > 2 MJup in 10-70 AU • Can’t be done from the ground or with other JWST instruments M4 M’=11.2 0.25 M
GPI/SPHERE/HiCIAO/etc. planets follow-up When JWST is launched, GPI and SPHERE will have completed their surveys • Will probe in 0.1”-1” at veryhigh contrast (10-7:1) • Will detect and characterizeplanets at <2.5 μm • Cannot observe at > 2.5 μm Expected GPI survey outcome • ~50 planets • Masses 1-10 MJup • a~5-40 AU • Proj. sep. 0.15”-1”
3.5-5.0 μm contains a significant fraction of total flux Madhusudhan et al. 2011 • Follow-up at 3.5-5 μm is important • Atmosphere characterization and luminosity measurement Cloud free Cloudy
Need TFI/NRM to follow-up GPI planetsat 3.5-5 μm Ground-based NRM limit TFI NRM limit Could find new planets here
Giant planets around low-mass stars • How often and where do gas giants form around low-mass stars compared to more massive ones? • Not thoroughly addressed by ground-based surveys(low-mass stars too faint for xAO systems) • TFI/NRM observations • 50 Myr 0.2 M star at 50 pc • Reaches ΔL’=8 or ΔM=8, at 70-400 mas • Corresponding to 1-3 MJup (L’~M~17-19) at 3-20 AU • TFI/NRM is the only way to probe same separation for low-mass stars as GPI/SPHERE will probe for more massive stars • Piggy-back science: molten proto-Earths afterglow CO2 Miller-Ricci et al. 2009
Spectral characterization of known planets • Highest contrast planets at >3.2 μm • Known from ground or found by NIRCam/MIRI • Planets not doable with NIRCam/NIRSpec in spectroscopy • Spectral features not covered by NIRCam filters • TFI offers R~90 • Using coronagraphy, spectral differential imaging, roll subtraction, reference star PSF subtraction, etc.
Some features best characterized with TFI Typical GPIplanet No coronagraph NIRCam filters
Some features best characterized with TFI No coronagraph NIRCam filters
In summary • Planet search around solar and low-mass stars in young SFRs • 3.5-5 μm characterization of known, small-separation (<0.3”) GPI/SPHERE/etc. planets • Planet search at 3-20 AU around young low-mass stars (within coronagraph IWA) • 3.5 μm characterization of known, wide-separation (>0.3”), high-contrast planets, specific narrow spectral features